One of the most talked about topics in the financial arena is the impending end of Quantitative Easing 2 dubbed (“QE2”). So what is QE2? Does the end of QE2 signify the end to the stock market rally? Any possibility of QE3?
For the purpose of this write-up, I have presented the gist of my thoughts in the form of Questions and Answers in an abridged manner to answer some of your queries.
Q1. What is QE2? What does it achieve?
A1: QE is an alternative monetary policy tool to stimulate the economy by driving down long term interest rates and increasing money supply in the financial system when conventional monetary policy tools are not effective.
In simple terms, the U.S. Federal Reserve (“Fed) prints money and buy government bonds and other financial assets. This achieves four objectives. Firstly, as it prints money to buy those government bonds and other financial assets, there is an inflow of “new money” into the financial system to boost money supply. Secondly, by buying these assets, it is able to influence (reduce) the long term interest rates. A reduction in interest rates is likely to encourage businesses and individuals to lend, spend and invest. Thirdly, as some of this new money is likely to flow into assets such as equities, this also has the effect of creating a “wealth” effect which should further stimulate spending and investing. Fourthly, the implementation of QE is likely to have averted a period of deflation or a prolonged period of falling prices. This is because after the aftermath of the financial crisis, inflation has decreased to an extent which might have led to deflation.
Q2. Why do we employ QE, instead of the conventional monetary policy tool?
A2: It is noteworthy that the Fed only has direct control over the Fed funds rate and the discount rate. In simple terms, the former is the rate at which banks lend to each other through the Fed. The latter is the rate at which the banks would be charged by borrowing from the Fed. Both the Fed funds rate and the discount rate are short term, usually overnight in duration.
A conventional monetary policy tool to influence the Fed funds rate is via open market operations (i.e. buy or sell short term government debt so as to reduce the short term interest rate.) However, the U.S. Fed has already slashed the U.S. Fed Funds rate from 5.25% in June 2006 to 0-0.25% in Dec 2008. Although the Fed funds rate serves as a benchmark for all other rates, it has lesser impact on longer term rates such as those rates charged on mortgage loans; car loans etc. Thus, to further stimulate the economy by encouraging people and businesses to borrow, spend and invest, the Fed decided to embark on QE to drive down long term interest rates and further increase money supply in the financial system.
Q3. Is this a new and unique tool used by the United States only?
A3. No. Japan was the first central bank to use QE to increase the money supply and to combat deflation. During the financial crisis in 2008, other central banks have employed this tool in various forms. For example, the European Central Bank (“ECB”) has augmented the pool of allowable assets that banks can use as collateral in return for euros.
Thus, what the Fed has utilized is an unconventional tool, but it is not a new and unique tool used by the Fed only.
Q4. Will there be a QE3?
A4: It is unlikely that there will be a QE3 in the near term. In order to assess whether QE3 is needed, we should evaluate the conditions between the time when QE1 ended in March 2010 and when QE2 is being hinted in Aug 2010, vis-à-vis the present conditions.
Firstly, based on Chart 1 below, despite QE1’s massive package of >US$1 trillion, the growth in money supply has been lackluster. However, with the formal announcement of QE2 in Nov 2010 (QE2 was hinted during Jackson Hole on 27 Aug 2010), money supply had improved significantly. One of the likely reasons why QE1 did not bring about a marked improvement in money supply is because the excess funds which were injected into the system were used to offset the financial institutions’ debt, thus cancelling the effect of QE1 to a certain extent. As a result, there is little change in money supply from the commencement to the end of QE1 which triggers the requirement for QE2.
Chart 1: Growth in money supply (“M2”) since QE1

Source: Bloomberg (as of 16 May 11)
Secondly, after the formal announcement of QE2 on Nov 2010, there was a huge uproar from many countries, political leaders etc. For example, China, Brazil and Germany warned that such a move (QE2) is likely to devalue the USD further (which we have seen) and spark a destabilizing flow of funds into emerging countries. Furthermore, even in the U.S., there were some dissent from Republican members of Congress who highlighted risks fueling inflation and asset bubbles from QE2.
Thirdly, headline and core consumer price index (“CPI”) have been creeping higher. On an unadjusted year-ago basis, the headline number was up 3.2% in April while the core CPI was up 1.3%. Although these numbers are not sky high, it does indicate that inflationary pressures are currently more evident than before (QE2 was announced).
Notwithstanding the above, if the economy dips back into recession (or faced with very poor economic data over several months), or there are large shocks to the financial system in the U.S., or external shocks from Europe or other economies triggering severe ripple effects to U.S., then QE3 may be possible. However, based on the available information now, we are unlikely to have a QE3 in the next couple of months.
Q5: The millionaire dollar question: Does this mark the end of the rally in the stock market?
A5: In order to tackle this question correctly, we have to distinguish the horizon (i.e. time period) that we are looking at. In the very near term (i.e. next 1-3 months), it is likely there is a perceived and psychological feeling or belief that markets are likely to face some form of correction, or at the very least, there is a lack of catalysts to catapult the stock markets higher. Based on Chart 2, the correlation between the price performance of S&P vis-à-vis that of the Reserve Bank Credit (i.e. the Fed’s balance sheet) seems to be quite high, except for a period of around Aug 2008 to Mar 2009.
Chart 2: Reserve Bank Credit vs. S&P 500 Index
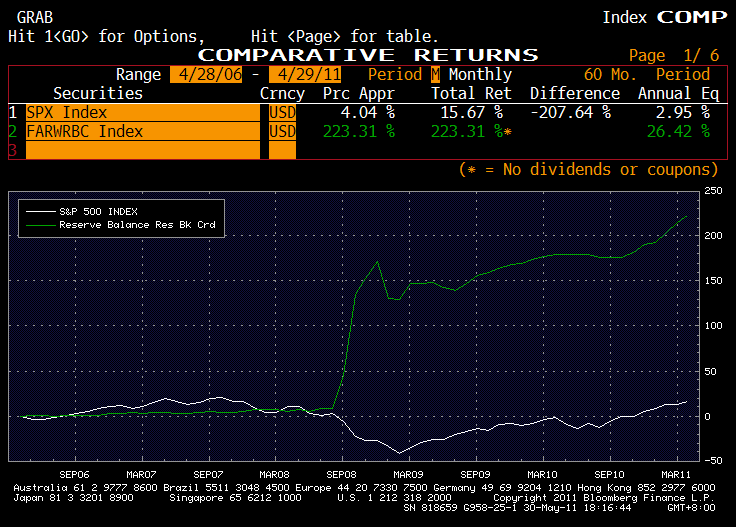
Source: Bloomberg (as of 29 Apr 11)
Although there seems to be a correlation between the Fed Bank Reserve Credit and S&P 500, there are three points that I like to point out.
Firstly, if we extend the horizon of the chart to a ten year chart, the correlation breaks down. I have done a correlation analysis between the Fed Bank Reserve Credit and S&P 500 from 30 May 2001 to 30 May 2011. The correlation coefficient for this ten year period is -0.36. (A correlation coefficient of +1.0 indicates perfect correlation whereas -1.0 indicates perfect inverse correlation.) This shows that the correlation is not an implicit guarantee that markets will definitely fall with the end of QE2.
Secondly, the Fed had indicated that they will continue to reinvest proceeds from the bonds as they mature, thus the impact of a sharp withdrawal of liquidity is less likely.
Thirdly, markets are forward looking. For the month of May, S&P and S&P GSCI spot index had already dropped 2.2% and 6.8% respectively in May, due in part to caution ahead of the end of QE2 (amid other factors).
In a nutshell, the answer to Q5 is that I expect near term bumps (next 1 – 3 months) in the equity markets as there is a perceived and psychological feeling that markets are likely to face some form of correction (sometimes, markets may drift downwards due to lack of buyers and not the emergence of heavy sellers). However, in the medium term, outlook for equities remains sanguine. According to Byron Wien, Vice Chairman of Blackstone Advisory Partners, S&P’s valuation has fallen to 14.8x earnings, which is near to this year’s low of 14.7, experienced after the Japan’s earthquake. Wien believes S&P is likely to end higher by the end of this year. So do I.
*This was recently sent out to my clients.
Disclaimer
The information contained herein is the writer’s personal opinion and is provided to you for information only and is not intended to or nor will it create/induce the creation of any binding legal relations. The information or opinions provided herein do not constitute an investment advice, an offer or solicitation to subscribe for, purchase or sell the investment product(s) mentioned herein. It does not have any regard to your specific investment objectives, financial situation and any of your particular needs. Accordingly, no warranty whatsoever is given and no liability whatsoever is accepted for any loss arising whether directly or indirectly as a result of this information. Investments are subject to investment risks including possible loss of the principal amount invested. The value of the product and the income from them may fall as well as rise. You may wish to seek advice from an independent financial adviser before making a commitment to purchase or invest in the investment product(s) mentioned herein. In the event that you choose not to do so, you should consider whether the investment product(s) mentioned herein are suitable for you. The writer will not, in any event, be liable to you for any direct/indirect or any other damages of any kind arising from or in connection with your reliance on any information in and/or materials appended herein. The information and/or materials are provided “as is” without warranty of any kind, either express or implied. In particular, no warranty regarding accuracy or fitness for a purpose is given in connection with such information and materials.
The information contained herein is the writer’s personal opinion and is provided to you for information only and is not intended to or nor will it create/induce the creation of any binding legal relations. The information or opinions provided herein do not constitute an investment advice, an offer or solicitation to subscribe for, purchase or sell the investment product(s) mentioned herein. It does not have any regard to your specific investment objectives, financial situation and any of your particular needs. Accordingly, no warranty whatsoever is given and no liability whatsoever is accepted for any loss arising whether directly or indirectly as a result of this information. Investments are subject to investment risks including possible loss of the principal amount invested. The value of the product and the income from them may fall as well as rise. You may wish to seek advice from an independent financial adviser before making a commitment to purchase or invest in the investment product(s) mentioned herein. In the event that you choose not to do so, you should consider whether the investment product(s) mentioned herein are suitable for you. The writer will not, in any event, be liable to you for any direct/indirect or any other damages of any kind arising from or in connection with your reliance on any information in and/or materials appended herein. The information and/or materials are provided “as is” without warranty of any kind, either express or implied. In particular, no warranty regarding accuracy or fitness for a purpose is given in connection with such information and materials.
Trading cryptocurrencies is a lucrative opportunity for many.
While crypto trading is profitable, it can be highly pernicious to the traders if not done properly.
By proper means, one should do it with the right set of tools and the right
mindset. Time waits for no one and the crypto exchage market is no exception. A plethora of cryptocurrencies, advanced tools, market volatility, and trading
strategies may all cause confusion to the new as well
as expert traders.
Fortunately, technology has made it possible for the traders
to automate the exchage process including market analysis,
order execution, predicting market trends, and more.
Automated crypto trading is one of the best practices used by computer programs/trading bots to buy
and sell cryptocurrencies. These software tools are intended
to react to market changes to trade at the right moment.
Traders can consider automate trading via the best crypto exchage platforms by making use
of trading bots, advanced orders, and more.
Automated trading
So, automated trading is a method of participating in crypto or
stock markets by using a program that executes pre-set rules for entering and exiting trades.
As the trader, you will combine thorough technical analysis with setting parameters for your positions, such as
orders to open, trailing stops, trailing stop loss orders, take profit,
etc.
Automated trading methods enable you to carry out many or multiple trades in a small amount of time, with the added benefit
of taking the emotion out of your decisions. That’s because all the rules
of the trade are already built into the preset parameters.
With some algorithms, the traders can even use the pre-determined strategies to follow trends and trade accordingly.
Automated crypto trading relies on algorithms which are actually the set of instructions used to solve computational issues.
In the crypto sphere, algorithms can trade digital assets on behalf of the traders.
And, the programs which use algorithms to trade are the bots.
The best platforms offer a variety of bots to the traders which work based on preset conditions, signals, market analysis, and more.
Usually, trading bots use APIs that help traders to interact with multiple exchanges.
wow, awesome blog.Really looking forward to read more. Much obliged.