Dukang Distillers –Price range bound since Nov 2012
I have previously written on Dukang two months ago citing that Dukang is still growing despite industry headwinds (See http://ernest15percent.com/index.php/2013/02/03/dukang-distillers-still-growing-despite/). Since then, Dukang reported a good set of 2QFY13F results. 2QFY13 revenue and net profit rose 37% and 52% y/y to RMB738m and RMB144m respectively. 1HFY13 rev and net profit were RMB1.14b and RMB208m respectively. It is noteworthy that 1HFY13 earnings were almost on par with their full year FY12 results. Dukang’s share price briefly saw a pop upon results (it closed at 0.310 before results) and went to an intraday high of $0.360 on 26 Feb before closing at $0.330 on 12 Apr, last Fri. With the share price being range bound since Nov 2012, is this a sign that smart money is not keen in Dukang, or are they merely taking their time to accumulate this stock?
Some interesting points to note
Undemanding valuations
Dukang trades at the historical PE and P/BV of 4.5x and 0.76x respectively. There is no forward PE as there is no rated analyst coverage. As mentioned above, 1HFY13 earnings were already almost on par with their full year FY12 results. Based on historical pattern, the upcoming 3Q is likely to be a seasonally strong quarter (However, do see Noteworthy point 2 below.) It should be reasonable to assume that FY13F PE should be 4x or lower. According to Bloomberg, its peers are trading at an average 13.2x FY13F PE.
Table 1: Dukang’s valuations vis-à-vis its peers
| Short Name | Cur | Last Px | Analyst TP | Change in TP | 1 Yr high | 1 Yr low | Adj Mkt Cap | FY12 PE | FY13F PE | ROE (%) | Hist P/BV | Hist Div Yield |
| Dukang Distiller | SGD | 0.335 | NA | NA | 0.37 | 0.21 | 267.4 | 4.5 | NA | 18.1 | 0.8 | NA |
| Kweichow Mouta-A | CNY | 172.14 | 234.27 | 36.1 | 266.08 | 160.45 | 35,728.2 | 13.4 | 10.4 | 45.0 | 5.2 | 2.3 |
| Jiangsu Yanghe-A | CNY | 62.89 | 92.92 | 47.8 | 156.48 | 59.52 | 13,578.8 | 11.3 | 10.8 | 53.6 | 5.1 | 2.0 |
| Luzhou Laojiao-A | CNY | 26.39 | 43.60 | 65.2 | 47.50 | 24.77 | 7,377.1 | 9.6 | 8.5 | 53.1 | 4.5 | 5.3 |
| Shanxi Xinghua-A | CNY | 32.22 | 41.64 | 29.2 | 46.62 | 27.27 | 5,577.3 | 21.0 | 14.6 | 43.9 | 7.9 | 0.8 |
| Anhui Gujingd-A | CNY | 27.00 | 45.40 | 68.1 | 53.18 | 23.10 | 2,460.4 | 18.2 | 16.2 | 26.1 | 4.3 | 0.8 |
| Sichuan Swell-A | CNY | 14.90 | NA | NA | 32.16 | 13.96 | 1,455.3 | 21.5 | 20.5 | 19.0 | 3.9 | 1.5 |
| Sichuan Tuopai-A | CNY | 20.18 | 16.10 | -20.2 | 40.38 | 18.63 | 1,360.8 | 18.4 | 14.0 | 16.9 | 2.9 | 0.9 |
| Jiuguijiu Co-A | CNY | 24.64 | 31.35 | 27.2 | 61.45 | 20.50 | 1,600.6 | 16.2 | 16.3 | 30.6 | 4.3 | NA |
| Wuliangye Yibin | CNY | 22.50 | 27.68 | 23.0 | 39.55 | 21.30 | 17,075.0 | 8.6 | 7.7 | 36.6 | 2.7 | 2.2 |
| Average ex Dukang | 15.4 | 13.2 | 36.1 | 4.5 | 2.0 | |||||||
Source: Bloomberg 12 Apr 13
No rated analyst coverage – A double edge sword
Similar to Guocoleisure, there is no rated analyst coverage for Dukang at this time. The drawback to this is that investors and fund managers are still not familiar with Dukang business and prospects, thus it may take some time for Mr Market to understand it. Conversely, investors who understand and believe Dukang’s prospects now can purchase it with a considerable margin of safety. On the investor relation aspect, Dukang has been working hard to engage the investment community by hosting analyst and fund manager visits over to their production sites in China.
Backed by S$0.168 net cash per share
Dukang has about RMB731m of cash on their balance sheet. Netting off loans, Dukang has about RMB671m or about S$0.168 net cash per share.
Technical charts are interesting
It has traded between a range of 0.305-0.360 since Nov 2012. At the closing price of $0.330 on last Fri, it is at the middle tier of the range. If there is a bullish breakout, either precipitated by a rated analyst report or good 3Q results or any other positive announcement, the measured target price is likely to be around $0.40. (See Chart 1)
Chart 1: Dukang traded between a range of 0.315-0.360 since Nov 2012
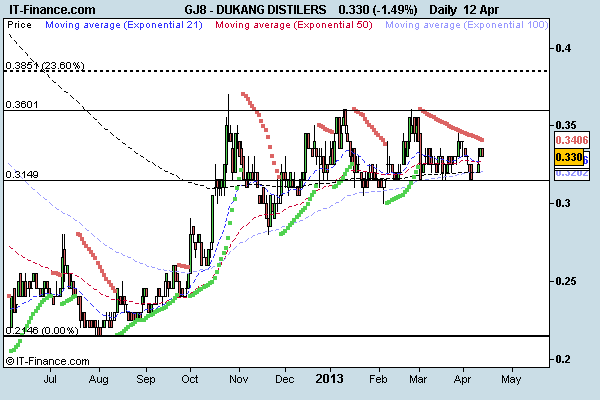
Source: CIMB itrade complimentary chart (12 Apr 13)
Some noteworthy points that investors should be aware of
Industry headwinds
As mentioned in my previous writeup, the ongoing government regulatory concerns pose major headwinds to the industry. Although Dukang mentioned during their 2QFY13 results that it was not much impacted by the current policies and the recent decline in the 1st tier baijiu brands is likely to have a positive impact on them, it remains to be seen as the effects of China’s regulations may take some time to materialise. A good gauge may be their 3QFY13F results and outlook on their business going forward. Furthermore, it is noteworthy that any new measures from the Chinese leaders would pose risks to the industry as a whole.
Relocation of Siwu likely to affect Siwu sales but effect is once off
In order to streamline their business, increase efficiency and cuts costs, Dukang had relocated the production of “Siwu” (四五) baijiu products from Henan Siwu’s production premises at Henan, Zhoukou City to the Group’s production premises at Henan, Luoyang City where “Dukang” (杜康) baijiu products are being produced. As a result of this relocation, Siwu’s production was affected during that time. However, the effect is once off and relocation and integration were completed on 21 Jan 13. (FYI, this may affect its 3QFY13 Siwu sales. However, this decline is likely to be offset by the rise in Dukang brand products.)
Conclusion – continued results and business outperformance likely to be the catalysts
Investors would be watching Dukang’s upcoming results, business execution amid the government regulatory concerns and their outlook on their baijiu business. If Dukang can consistently deliver, it may not be long before investors warm up to the stock.
Readers can refer to my previous writeup on Dukang (link above) for more info. If you are interested to know more about Dukang, you can drop me an email at crclk@yahoo.com.sg and I will send you the latest unrated analyst report.
Disclaimer
The information contained herein is the writer’s personal opinion and is provided to you for information only and is not intended to or nor will it create/induce the creation of any binding legal relations. The information or opinions provided herein do not constitute an investment advice, an offer or solicitation to subscribe for, purchase or sell the investment product(s) mentioned herein. It does not have any regard to your specific investment objectives, financial situation and any of your particular needs. Accordingly, no warranty whatsoever is given and no liability whatsoever is accepted for any loss arising whether directly or indirectly as a result of this information. Investments are subject to investment risks including possible loss of the principal amount invested. The value of the product and the income from them may fall as well as rise. You may wish to seek advice from an independent financial adviser before making a commitment to purchase or invest in the investment product(s) mentioned herein. In the event that you choose not to do so, you should consider whether the investment product(s) mentioned herein are suitable for you. The writer will not, in any event, be liable to you for any direct/indirect or any other damages of any kind arising from or in connection with your reliance on any information in and/or materials appended herein. The information and/or materials are provided “as is” without warranty of any kind, either express or implied. In particular, no warranty regarding accuracy or fitness for a purpose is given in connection with such information and materials.
The information contained herein is the writer’s personal opinion and is provided to you for information only and is not intended to or nor will it create/induce the creation of any binding legal relations. The information or opinions provided herein do not constitute an investment advice, an offer or solicitation to subscribe for, purchase or sell the investment product(s) mentioned herein. It does not have any regard to your specific investment objectives, financial situation and any of your particular needs. Accordingly, no warranty whatsoever is given and no liability whatsoever is accepted for any loss arising whether directly or indirectly as a result of this information. Investments are subject to investment risks including possible loss of the principal amount invested. The value of the product and the income from them may fall as well as rise. You may wish to seek advice from an independent financial adviser before making a commitment to purchase or invest in the investment product(s) mentioned herein. In the event that you choose not to do so, you should consider whether the investment product(s) mentioned herein are suitable for you. The writer will not, in any event, be liable to you for any direct/indirect or any other damages of any kind arising from or in connection with your reliance on any information in and/or materials appended herein. The information and/or materials are provided “as is” without warranty of any kind, either express or implied. In particular, no warranty regarding accuracy or fitness for a purpose is given in connection with such information and materials.