Recently, one of my buddies invited me to Cheung Woh’s (“CW”) company presentation at Financial PR (“FPR”). Given their good set of FY15F results vis-à-vis FY14 and FY13, I decided to attend as there may be interesting updates from the company. Mr Law Kung Ying, Chairman of CW (“Management”) and FPR hosted the meeting.
Firstly, what does CW do?
CW was founded in 1972 and has been listed on our Singapore Main Board since Dec 2002. Readers can refer to Figure 1 below and their company website http://www.cheungwoh.com.sg/ for more information.
Figure 1: CW – in a nutshell
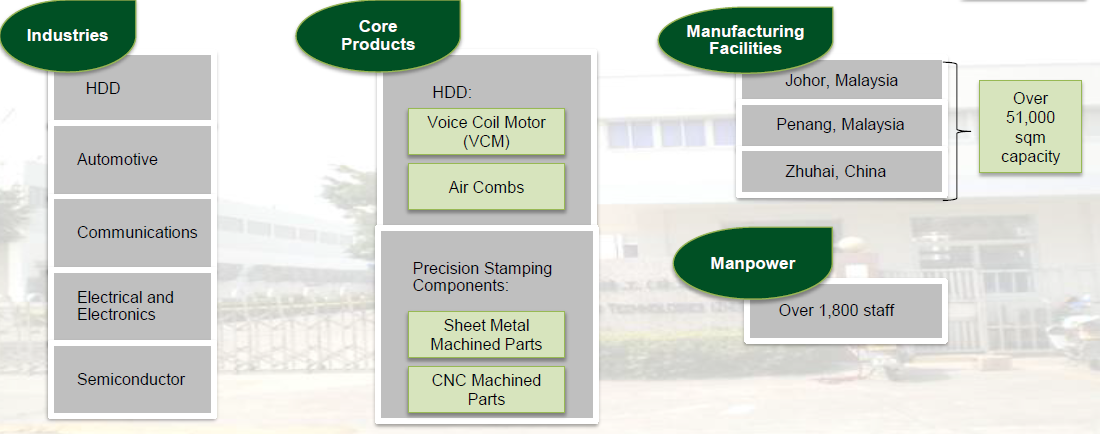
Source: Financial PR
So what’s interesting about CW?
CW’s HDD segment serves top 2 HDD clients which have a combined >80% market share
CW’s hard disk drive (“HDD” segment serves the top two HDD manufacturers. Both HDD manufacturers (let’s name them customer “A” and customer “B”) command >80% of the HDD market. For the products that CW supplies, customer A and B have three and four HDD component suppliers respectively. According to management, CW has 50% market share in the products that it supplies to each customer A and B.
What is noteworthy is that there is a likelihood that customer A and B may be reducing their number of suppliers to three and two suppliers respectively in the future. If this materialises, it should have a positive effect on CW.
Enterprise HDD demand is growing
According to an IDC May 2015 report, the personal computer (“PC”) segment contributed more than 45% of industry petabyte shipments, and revenue in 2014. However, by 2018, IDC postulates that the enterprise segment will overtake the PC segment to generate more than 40% of HDD industry revenue and 45% of HDD petabyte demand. (1 petabyte = 1m gigabytes).
A separate research by Forbes dated Jan 2015 estimates that the demand for the storage capacity in digital libraries is growing at 40% p.a. This outstrips the 15% growth p.a. in the HDD storage capacity which may spur more unit demand for HDDs in the next few years.
As CW’s HDD components are used in the enterprise segment, the above developments bode well for CW.
Results seem to corroborate this strong turnaround
With reference to Chart 1 below, FY15 revenue soared 55% from S$59.3m in FY2014 to S$91.9m in FY2015, driven by a 72% jump in HDD sales. Management shared that it previously served one top HDD manufacturer. However, it started to target the second HDD manufacturer and it took them two years before there was significant contribution in FY15. In other words, FY15’s good results are unlikely to be once off.
Furthermore, management shared that due to the Thai flood and the previous costs squeeze on the HDD component manufacturers, there are fewer HDD component manufacturers now. As a result, the HDD manufacturers are cognizant of this and they have not exerted cost down pressures on CW for the past one year.
In the most recent 1QFY16 results announced on 10 Jul 2015, 1QFY16 revenue and net profit jumped 11% and 40% on a year on year comparison to S$21.2m and S$3.2m respectively.
Chart 1: CW’s past five year revenue
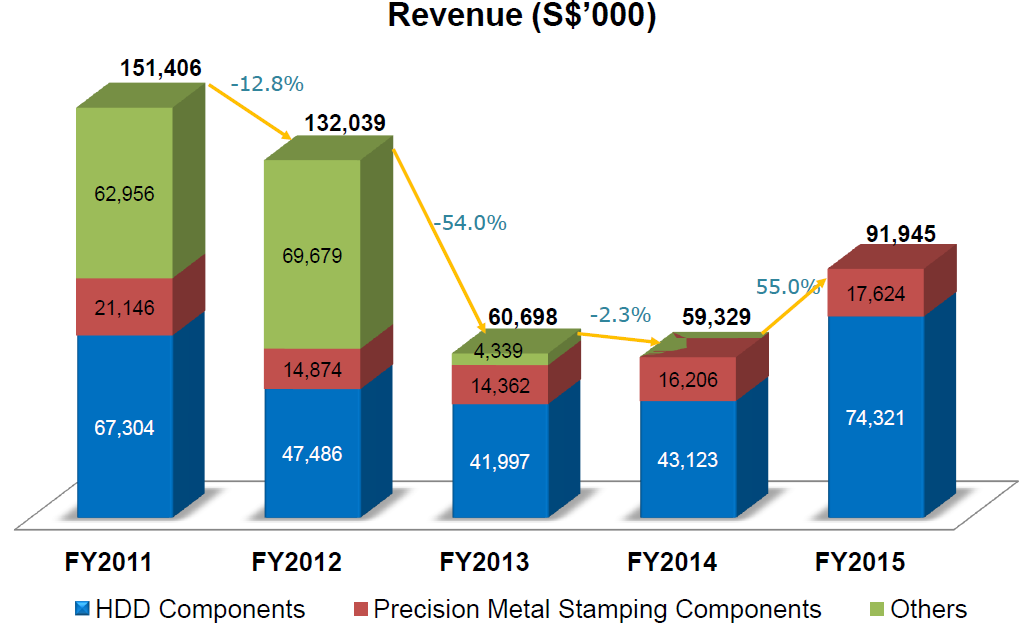
Source: Financial PR (Financial year end is Feb)
R&D efforts may yield exciting products in the future
In line with their annual report 2015, Management reveals that they are working with their customer to undertake research and development to design, develop and manufacture new types of components. If this succeeds in the next two to three years, this new product may be able to contribute an additional 50% jump in sales (assuming sales remain flat at FY15 levels).
Cheap valuations
Based on my personal calculations, at CW’s closing price of $0.235 on 16 Jul 2015, it trades at a historical 5.6x FY15PE, vis-à-vis its nearest Singapore peer Broadway at 63x FY14 PE.
Based on its 1QFY16 results announced on 10 Jul 2015, CW has turned net cash. By excluding the net cash and annualising its *1QFY16 earnings, CW trades at around 5.1x which is at the lower end of its PE range of 4.7x – 43x since Mar 2012. CW’s net asset value / share is $0.360.
*It is noteworthy that 2H is typically stronger than 1H results for CW.
Some noteworthy points on Cheung Woh
HDD segment is a maturing industry
Although CW can target the growing enterprise segment, it is noteworthy that the HDD segment is a maturing industry. In the long term (say next 10 – 20 years), there may come a time where most storage demand can be satisfied by solid state drive (utilises flash memory).
CW likely to remain low profile
Management candidly shares that they will continue to devote time to develop their business further. However, they currently do not intend to employ any investor relation firm to “promote” their shares. Furthermore, there is no analyst coverage (rated or unrated) at the moment. Thus, CW is likely to remain low profile, except for those investors who understand their company and prospects.
Illiquid and small market cap of S$71m
With reference to Figure 2 below, the top twenty shareholders have about 84.5% of CW’s outstanding shares. Thus, there is little free float outside which results in its illiquidity. Average 30D and 100D volume amounts to 40,000 shares and 97,000 shares respectively. This is not a liquid company where investors can enter or exit quickly.
Figure 2: CW’s top 20 shareholders as at 13 May 2015
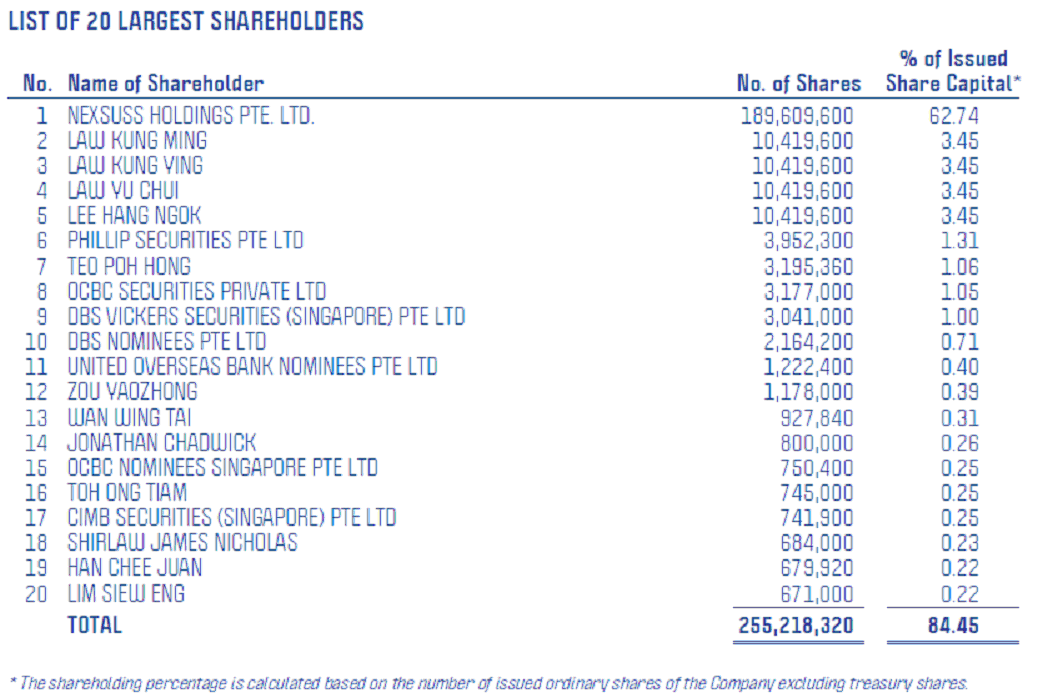
Source: Company Annual Report FY15
**CW chart analysis
Based on Chart 2 below, CW has been on a firm uptrend since early 2014. It has been trading within a range of $0.220 – 0.250 since 15 Apr 2015. There seems to be some buying interest for the past three days. An upside or downside breakout has a measured eventual technical target of $0.280 / 0.190. Given the weak ADX of 14.0 on 16 Jul 2015, it is unlikely to make a sustained break above 0.250 in the near term.
Supports: $0.230 / 0.215-0.220
Resistances: $0.240 / 0.250
**Chart analysis on CW may be skewed (i.e. less effective) as it is extremely illiquid.
Chart 2: CW range trading since 15 Apr 2015-07-19
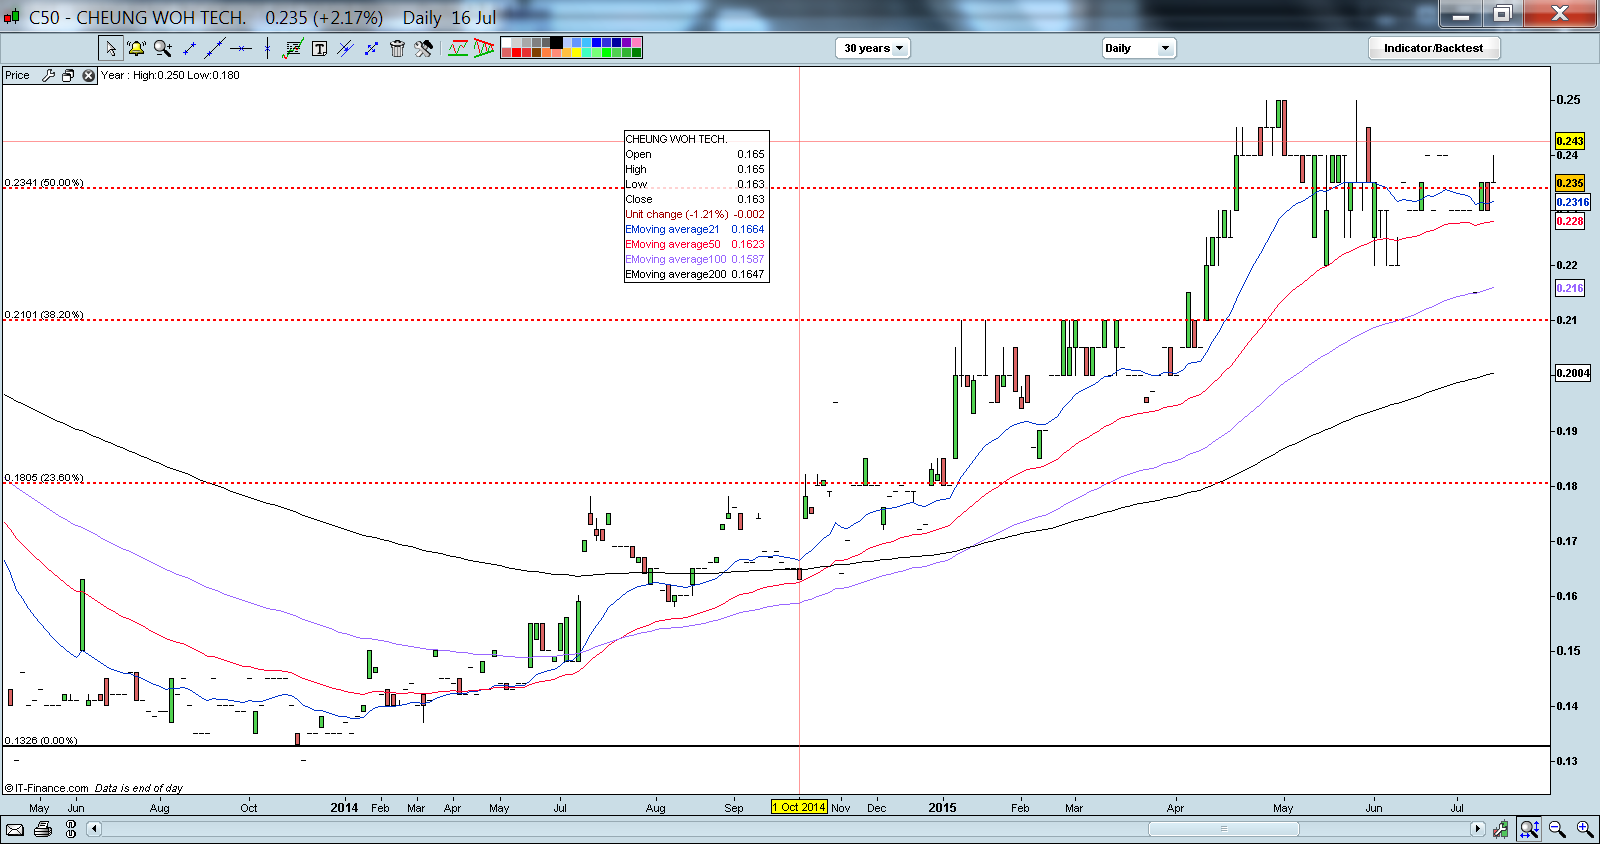
Source: CIMB chart as of 16 Jul 2015
Conclusion
As CW is not covered by any analyst and likely remains low profile, I have taken some time to do a writeup on CW so as to provide some background information on CW to readers. Given CW’s cheap valuations and recovering results, this is a company where readers can consider taking a closer look. Nevertheless, I hasten to add that the above is only a brief introduction on CW. Readers are encouraged to refer to the company website http://www.cheungwoh.com.sg/ and their annual reports for the past years to have a better understanding of the company’s business, management, prospects, risks etc.
Disclaimer
Please refer to the disclaimer here http://ernest15percent.com/index.php/disclaimer/