Dear readers,
The past two weeks have been eventful with the conclusion of the FOMC meeting on 18 Sep with no rate hike, amid concerns on an uncertain outlook for global growth, recent financial-market turmoil and low inflation. However, during Fed Chair Yellen’s speech at the University of Massachusetts at Amherst on 25 Sep morning (Singapore time), she said that the Fed is on track to raise interest rates in 2015, barring unforeseen economic surprises. Markets have whipsawed as they try to determine the timing of the rate hike (the first in almost a decade) and its impact on the markets.
What can investors or / and traders do now?
In my write-up on the chart analyses on the various markets published on 29 Aug 2015 http://ernest15percent.com/index.php/2015/08/29/ernests-market-outlook-31-aug-15/, I have mentioned that the markets are likely to be staging a technical rebound in downtrend markets and they do not constitute a trend reversal. Below are my latest chart analyses / personal opinions on the various markets.
S&P500 Index
With reference to Chart 1 below, S&P500 broke the uptrend line of the ascending triangle chart pattern on 18 Sep 2015 and it failed to close above it on 19 Sep 2015. There seems to be some subsequent follow through selling. On a longer term perspective, it is noteworthy that S&P500 has also broken the major uptrend established since Oct 2011. In addition, S&P500 100D exponential moving average (“EMA”) has formed a death cross with 200D EMA on 22 Sep 2015. Furthermore, the S&P 500 health-care sector, one of the previous leaders in terms of share price performance has closed below its Aug 24 lows. S&P500 closed at 1,931 on last Fri.
Overall, it looks bearish. A measured downside technical target after the breakdown of the ascending triangle formation points to around 1,842. It remains to be seen whether this will be reached but my personal feel is that the odds of (at least) testing the Aug 24 low of around 1,867 are >50%. A break above 2,000 – 2,005 should alleviate some of the bearish tinge on the chart.
Near term supports: 1,909 / 1,893 / 1,867
Near term resistances: 1,965 – 1,970 / 1,979
Chart 1: S&P500 broke the ascending triangle formation last week
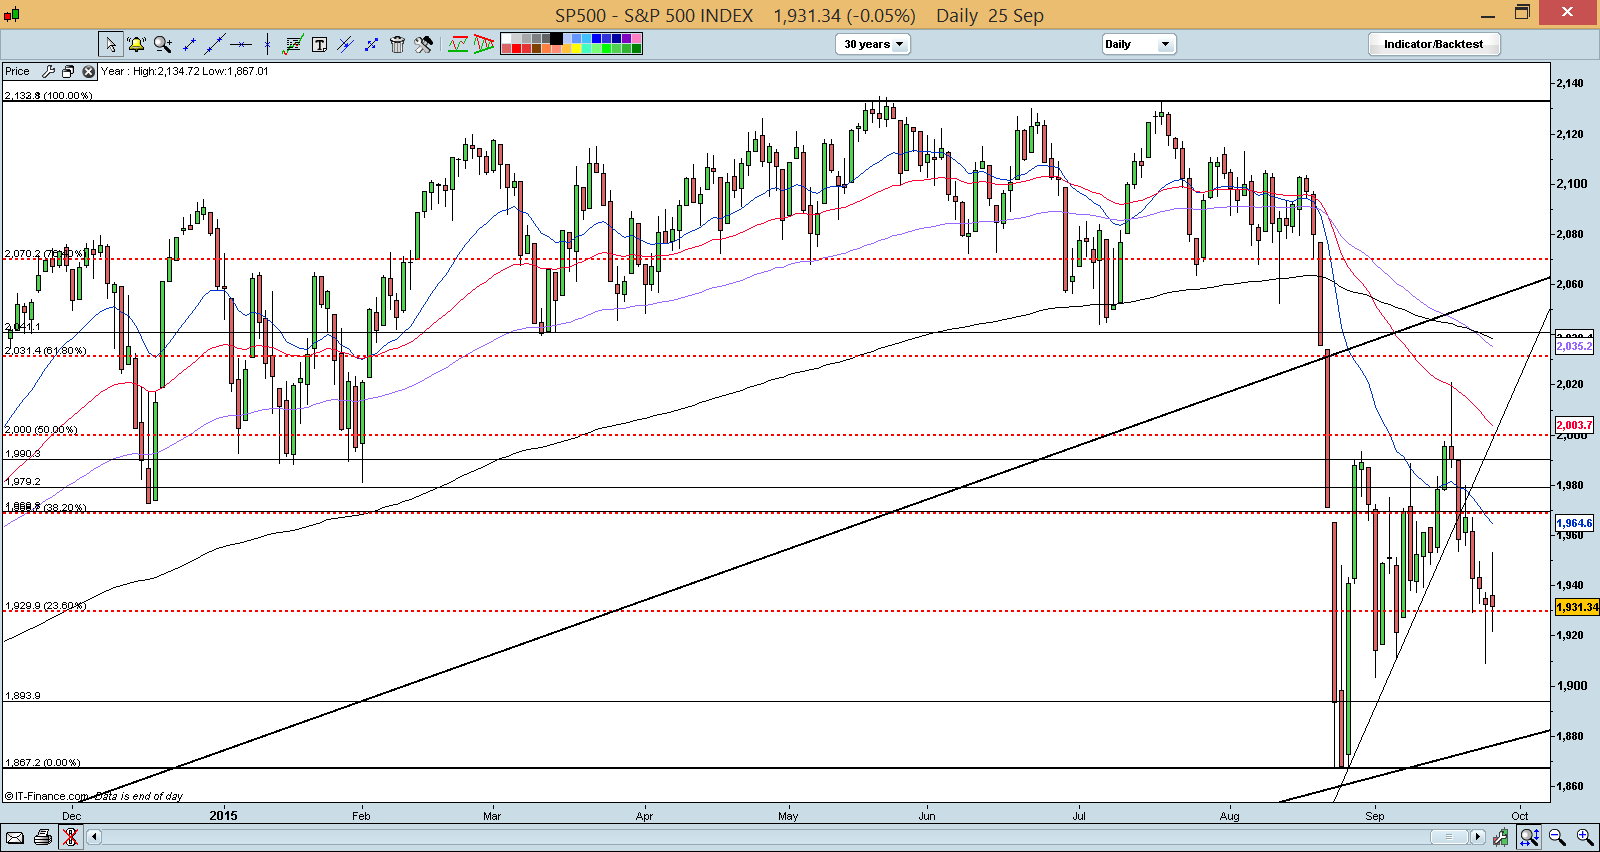
Source: CIMB chart as of 25 Sep 15
Hang Seng Index
After the technical rebound seen on 8 and 9 Sep, Hang Seng continues to be range bound. It fails to breach the downwards resistance line (seen in Chart 2 below). Hang Seng continues to be in a downtrend and it is likely that it may retest 20,525, the 8 Sep low. Chart outlook continues to be bearish. A break above 22,400 should negate the bearish tinge. Hang Seng closed at 21,186 last Fri.
Near term supports: 20,933 / 20,525 / 20,305
Near term resistances: 21,641 / 21,741 / 22,090
Chart 2: Hang Seng likely to test 20,525, the 8 Sep low

Source: CIMB chart as of 25 Sep 15
STI Index
STI broke the several times tested support of 2,843 on last Fri and closed at 2,833. This break is bearish and points to a measured technical target of around 2,757 (See Chart 3 below). A breach above 2,929 negates the bearish tinge in this chart.
Near term supports: 2,808 / 2,764 / 2,757
Near term resistances: 2,843 / 2,907 / 2,929
Chart 3: STI broke the several times tested support of 2,843

Source: CIMB chart as of 25 Sep 15
FTSE ST Small Cap Index (“FSTS”)
FSTS seems to have gained relative strength vis-à-vis the STI index. It closed at 409 last Fri. Nevertheless, at this point, it is unlikely to stage a V shape reversal given
1. The weakness in the other indices (e.g. STI, Hang Seng, S&P500);
2. There are no visible chart reversal patterns. At the very least, it is likely that FSTS should consolidate first after having dropped a massive 22% from the start of the year to 25 Aug 2015.
FSTS is likely to meet a key near term resistance at around 422 – 424. Near term supports are at 405 / 401.
Chart 4: FSTS gained relative strength; near term resistance 422-424

Source: CIMB chart as of 25 Sep 15
Disclaimer
Please refer to the disclaimer here http://ernest15percent.com/index.php/disclaimer/.