Dear all,
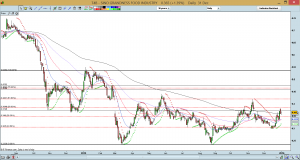
Since 8 Sep 2014, Sino Grandness (“SFGI”) has traded below its 200D exponential moving average (“EMA”). 14 months later, on 6 Nov 2015, it moved above its 200D EMA and stayed there for four trading days but slipped below it again. On 29 Dec 2015, it managed to breach its 200D EMA at $0.360 and closed above it. About 2.9m shares were transacted on that day which is more than a month’s high trading volume. This is a positive step.
Secondly, 21D EMA has just formed golden crosses with 50D EMA and 100D EMA. ADX has moved from 15.4 on 21 Dec to close at 23.7 on 31 Dec, indicative of a trend. OBV is near multi month highs but not at an all-time high.
Overall, based on Chart 1 below, the set-up is positive but we have to observe this coming week whether it can continue to hold above its 200D EMA.
Near term supports: $0.360 / 0.350 / 0.335 – 0.340
Near term resistances: $0.375 – 0.380 / 0.410 / 0.420
Chart 1: SFGI managed to close on or above its 200D EMA for 3rd consecutive day

Source: CIMB chart as of 31 Dec 15
Valuations
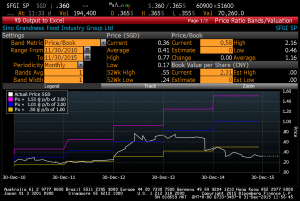
With reference to Chart 1 below, SFGI trades at around 0.57x Price to Book (“P/BV”). It has traded between 0.46x – 2.16x between 30 Nov 2010 and 30 Dec 2015. Its net asset value per share is $0.636.
Chart 1: SFGI trades at the lower end of its 5-year P/BV range.
Source: Bloomberg as of 31 Dec 15
Based on Bloomberg, it is trading at 4.7x FY14 PE. Using the 9MFY15 adjusted earnings from SFGI 3QFY15 press release, it is trading at approximately 2x PE based on an annualised FY15F earnings. With reference to Tables 1 & 2 below, its Hong Kong peers are trading at an average 24x FY15F PE and 21x FY16F PE.
It is noteworthy that the above SFGI’s FY15F PE of 2x is just my back of the envelope calculation. There may be some expenses to be recognised in 4QFY15F which are not reflected in their 9MFY15 results.
Table 1: Comparison of SFGI vis-à-vis *Singapore peers
Source: Bloomberg as of 31 Dec 15
*China Minzhong and Yamada are not currently covered by analysts hence I did not put in an “average ex Sino Grandness row”) in there as its not meaningful.
Table 2: Comparison of SFGI vis-à-vis Hong Kong peers
Source: Bloomberg as of 31 Dec 15
Conclusion
In conclusion, I like to reiterate that this is a write-up to alert readers on the potential positive chart set-up. We still have to observe whether it can close above $0.360 this week, preferably with follow through buying. This is a high risk stock with considerable price swings and subject to development of its key events such as updates on Garden Fresh’s IPO and convertible bonds (“CB”). As of now, there is no further update on either IPO or / and CB.
As mentioned previously, readers who wish to be notified of my write-ups and / or informative emails, they can consider to sign up at http://ernest15percent.com so as to be included in my mailing list. However, this reader’s mailing list has a one or two-day lag time as I will (naturally) send information (more information, more emails and more details) to my clients. For readers who wish to enquire on being my client, they can consider to leave their contacts here http://ernest15percent.com/index.php/about-me/
P.S: I have alerted my clients twice on SFGI in Dec. Firstly, I have alerted those active clients with high risk profile that they can take a look at SFGI, arguably with a potential favourable risk reward play when it was trading at $0.310 in mid Dec. Secondly, I have alerted all clients (via an email on 30 Dec morning) on SFGI’s chart development as SFGI first closed above $0.360 on 29 Dec with a month’s high trading volume.
Disclaimer
Please refer to the disclaimer here


I really enjoy the article. Cool.