Innovalues has been on a tear lately. It has risen for five out of six trading days, up 15% since $0.780 on 24 Mar 16 with increasing volume to close at $0.900. For the past week, Innovalues’ daily volume has consistently exceeded its average 30D and 100D volume amounting to 1.2m and 0.88m shares respectively. 21D exponential moving average (“EMA”) has pulled apart from 50D EMA after converging which is a positive sign. All its EMAs are rising, indicative of a good uptrend. ADX has started to climb from 9.8 on 24 Mar 2016 to close at 23.7 on 1 Apr 2016, indicative of a trend. Its RSI closed at 72.8 last Fri. Although it is slightly overbought, all time high RSI is around 93.3.
To sum up, based on Chart 1 below, Innovalues’ chart looks strong and it does not seem to be extremely overbought yet. Nevertheless, as Innovalues has bucked the trend by surging 15% in the past six trading days, compared to a 1% drop in the STI, there may be some minor profit taking. However, based on the chart now, the trend should still be up and it is likely to challenge its nine-year high of $0.940. A sustained break below $0.865 – 0.870 negates the bullish tinge in the chart.
Near term supports: $0.900 / 0.865-0.870 / 0.840
Near term resistances: 0.940 / 0.950 / 0.975
Chart 1: Innovalues may test its nine-year high of $0.940
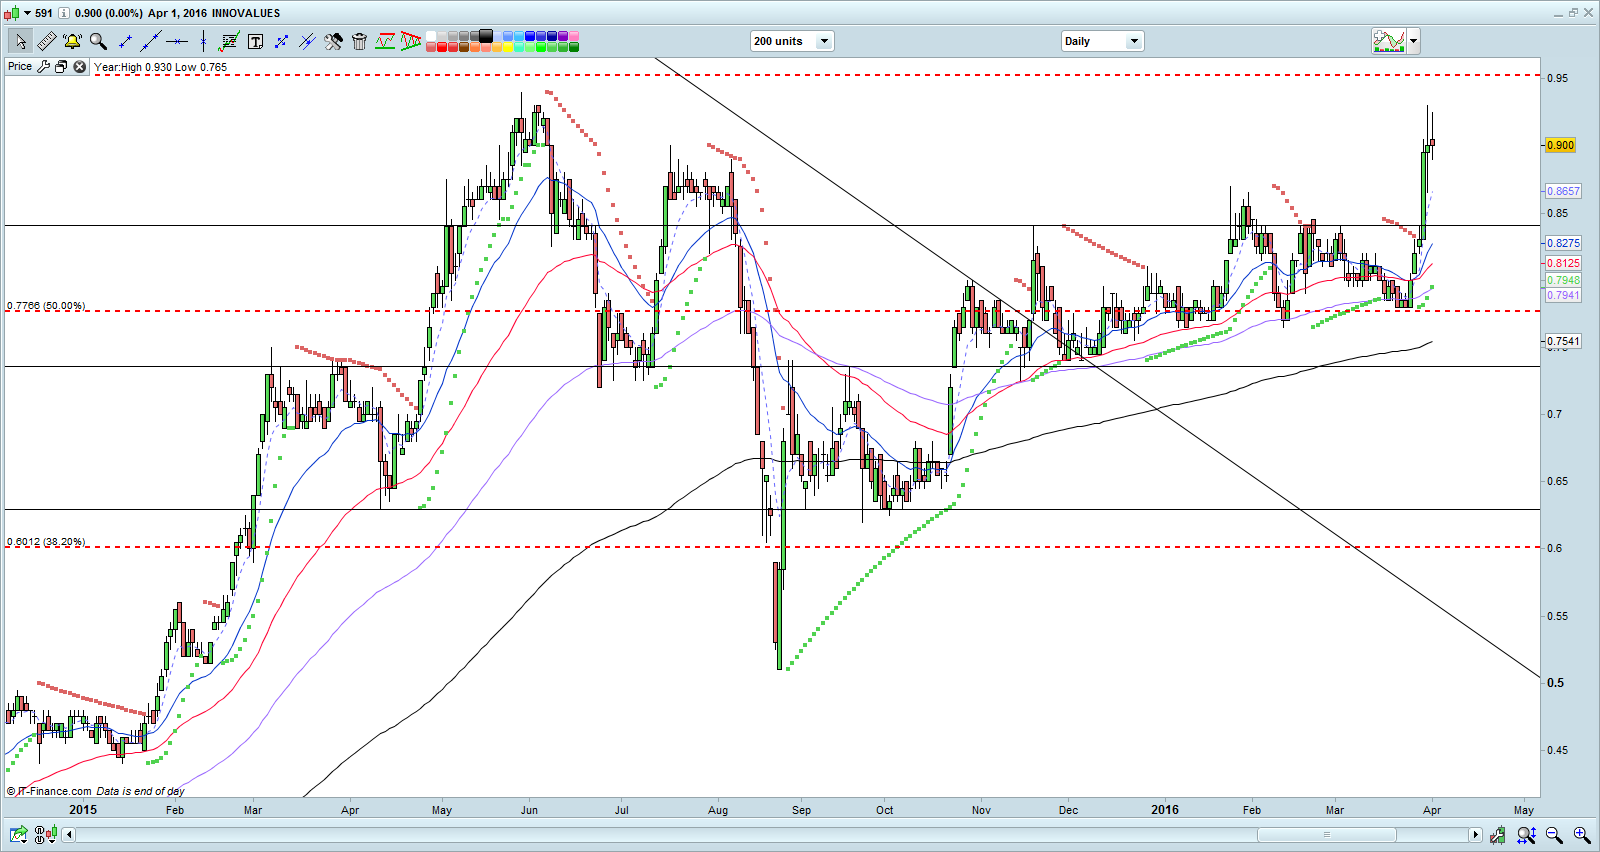
Source: CIMB’s complimentary chart as of 1 Apr 2016
P.S: Do note that as I have sent out an email to my clients on 30 Mar 2016, Wed early afternoon to alert clients that Innovalues may challenge its recent resistance of $0.870. It was trading around $0.860 at that time.
Disclaimer
Please refer to the disclaimer here