Dear all
Based on Chart 1 below, Oxley seems to be an interesting stock. Last Fri (9 Sep 2016) was the T+6th day after its sharp rally. The recent price decline from $0.445 was accompanied with weak volume. (My personal guess is that contra players have been taking profit for the past few days). Broadly speaking, the stock has been stuck in a one-year trading range between $0.380 – 0.460. ADX has declined from an unsustainable 69 on 2 Aug 2016 to around 37 on 13 Sep 2016. All the exponential moving averages (“EMAs”) have stopped their declines with 20D, 50D and 100D EMA moving higher. 20D EMA has formed a golden cross with 50D EMA and on the verge of forming one with 100D EMA.
RSI has declined from the recent high of 80 to around 60 on 13 Sep 2016. For the recent two days, Oxley managed to close at an intraday high at $0.420, despite touching intraday lows of $0.410 and $0.405 on 9 & 13 Sep respectively.
A breakout from $0.460 accompanied with volume expansion points to an eventual technical measured target of around $0.540. OBV is near a two year high whereas RSI and MACD have shown encouraging developments. Conversely, a breakdown from $0.380 points to an eventual technical measured target of around $0.300. Based on the chart outlook, and coupled with the possibly set of record results in FY17F, the odds of a breakout from $0.460 seem to be higher.
Near term supports: $0.410 – 0.415 / 0.400 / 0.390
Near term resistances: $0.420 / 0.435 / 0.450
Chart 1: Oxley – Base building between $0.380 – 0.460
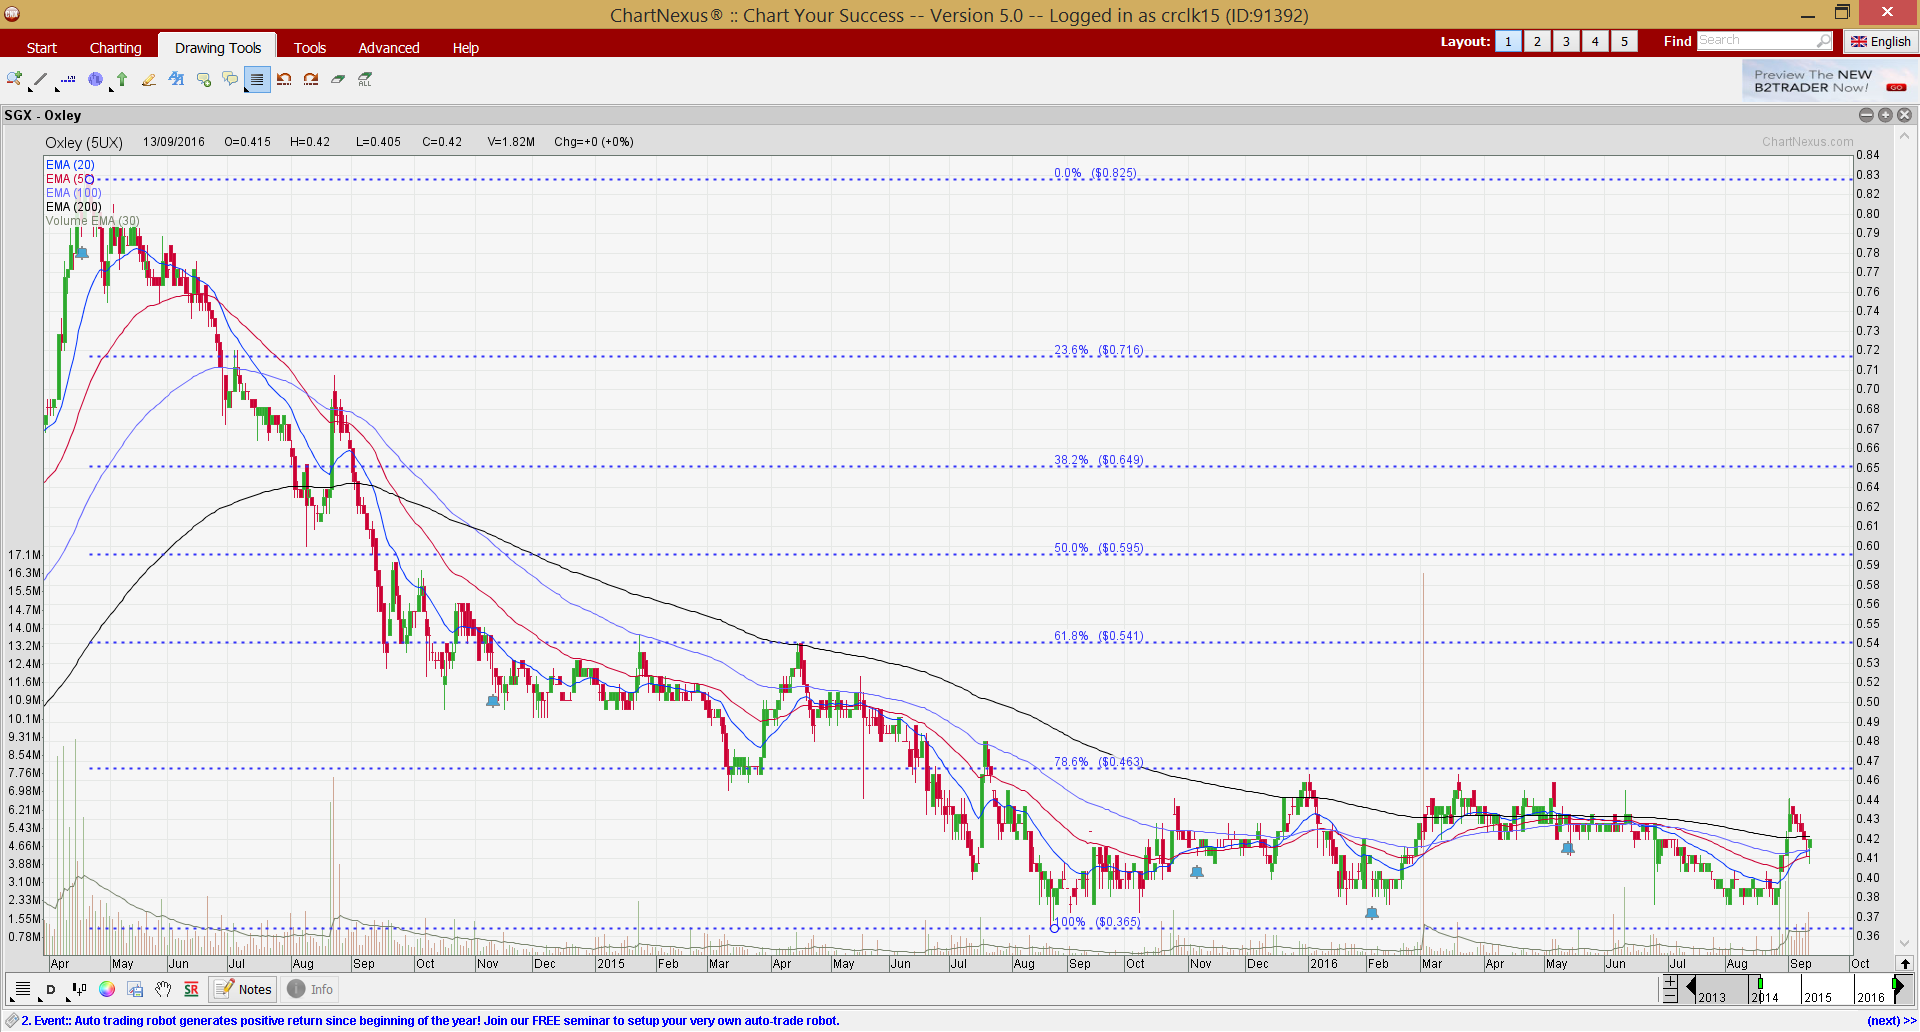
Source: Chartnexus as of 13 Sep 16
Some of the developments are
1. Oxley enters Chongqing
Based on their announcement dated 5 Sep 2016, Oxley intends to develop an integrated medical hub in the Chongqing Liangjiang New Area via a Strategic Cooperation Framework Agreement.
2. Just completed a China / HK investor conference the week of 5 Sep
During their post results briefing hosted in end Aug in Singapore, management seems to be pretty positive on the company outlook. (Refer to point 4 below)
3. Company share buyback, coupled with management buybacks
Since Jun 2016, Oxley has bought back shares between $0.385 – 0.420 with the latest purchases on 9 Sep 2016. Oxley executive chairman and CEO Ching Chiat Kwong has also bought in the shares in Jun 2016 between $0.420 – 0.428.
4. FY17F is likely to be a record year
FY17F seems likely to be a record year on the back of contributions from Oxley Tower and Phase 1 of The Royal Wharf. RHB estimates that Oxley Tower can contribute about S$500m to Oxley’s FY17F revenue. It also postulates that approximately S$1.9b worth of projects should receive T.O.P. in the next 12 months. As a result, RHB expects FY17F to be a record with net profit of $350-360m.
Some noteworthy risks
With (almost) all investments, there are bound to be risks. For Oxley, some of the risks may be the following:
1. S$1.4b of debt maturing in 12 months
According to Oxley’s FY16 press release, it reduced its net gearing ratio decreased from 3.1x as at 30 June 2015 to 2.8x as at 30 June 2016 on the back of strong revenue and cost recognition. On the back of strong revenue and cost recognition on completion of Oxley Tower in Singapore and the progressive completion and handover of units to buyers of Phase 1 of The Royal Wharf, Oxley expects that gearing will be further reduced in FY17F. It is noteworthy that Oxley has about S$1.4b debt maturing in less than 12 months as compared to its cash holdings of S$551m as of 30 June 2016. However, out of this S$1.4b debt maturing in less than 12 months, 73% is project debt. (See Figure 1 below on its debt profile and un-leveraged property asset).
Figure 1: Debt profile and un-leveraged property asset
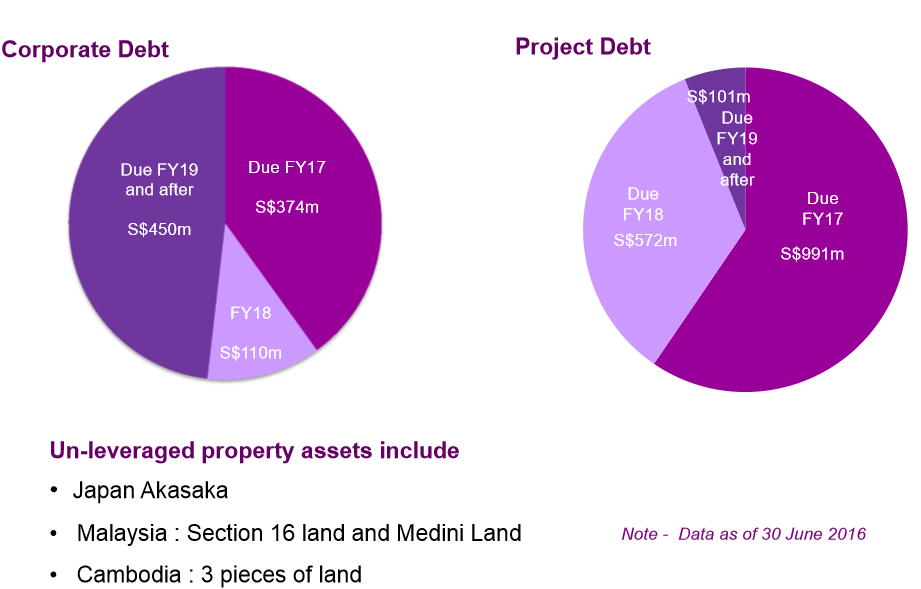
Source: Company
2. Only one rated analyst report
Based on Bloomberg, there is only one rated analyst coverage on Oxley by RHB with a target price of $0.910. Thus, it should be reasonable to assume that the investment community may not be fully familiar with the company. On this front, besides focusing on its business, Oxley has done a post results briefing in end Aug and it has just completed a China / HK investor conference the week of 5 Sep 2016 to raise investor awareness in the company.
3. Illiquid stock
Oxley is an illiquid stock. Its average 30D and 100D transacted volume amounted to 824K and 463K shares respectively. Consequently, it is not easy for investors to either buy or sell Oxley in meaningful sizes. For example, if there are investors with significant positions who wish to exit Oxley, they may have to sell down several levels.
4. Not very familiar with the company yet
Oxley has been arguably touted as one of the most aggressive property companies in Singapore. Personally, I have just got to know about this company through their results briefing in end Aug 2016. Thus, I am not very familiar in this company yet. (What attracts me to take a closer look is its chart). Furthermore, what I have written above, is a compilation from the press releases announced on SGX and also based on my personal chart interpretation.
The above risks are just some of the risks that readers have to be aware. It is not an exhaustive list.
Conclusion – chart looks positive
In my opinion, the most attractive point in Oxley is in its chart. Oxley seems to be building a base between $0.380 – 0.460 for a year. Coupled with likely record result in FY17, the odds of an eventual breakout of $0.460 seem higher than a breakdown. Nevertheless, do be aware of the aforementioned risks.
This is merely an introduction to the company. Readers should check out Oxley’s company website (click HERE) for more information.
Disclaimer
Please refer to the disclaimer HERE