Dear readers,
S&P500 reached my measured technical target of 2,120 and rebounded. STI continues to be trapped in a range. What’s next?
S&P500 Index
Just to recap what I have mentioned on 9 Sep 2016 (see HERE), I wrote “The break below 2,157 on 9 Sep 2016 points to an eventual measured technical target of around 2,120. With this sharp plunge, RSI has declined from 59 on 19 Aug 2016 to around 32 on 9 Sep 2016. It is noteworthy that since Aug 2015, S&P500 typically staged a rebound when RSI reached around 27 – 32. Amid the sharp plunge in RSI, S&P500 is likely to find good support around 2,114 – 2,125 in this selloff. If this breaks, the next good support region should be around 2,089 – 2,092.”
–> The above was spot on. On 12 Sep 2016, S&P500 opened lower at 2,121 and touched an intraday low of 2,119 on the same day. i.e. it touched my measured technical target of 2,120. With this decline, RSI hit around 30 which sparked the expected rebound. S&P500 closed at 2,165 on 23 Sep 2016.
Based on Chart 1 below, S&P500’s volatility has increased since 9 Sep 2016. RSI has increased around 32 on 9 Sep 2016 to 52 (a neutral level) on 23 Sep 2016. All the exponential moving averages (“EMAs) are still trending higher. Although the trend continues to be an uptrend, my personal view is that S&P500 is likely to trade 2,093 – 2,194 in the next two to four weeks with increasingly volatility.
Near term supports: 2,151 – 2,157 / 2,130 / 2,117
Near term resistances: 2,180 / 2,194 / 2,200
Chart 1: S&P500 touched my measured technical target 2,120 before rebounding
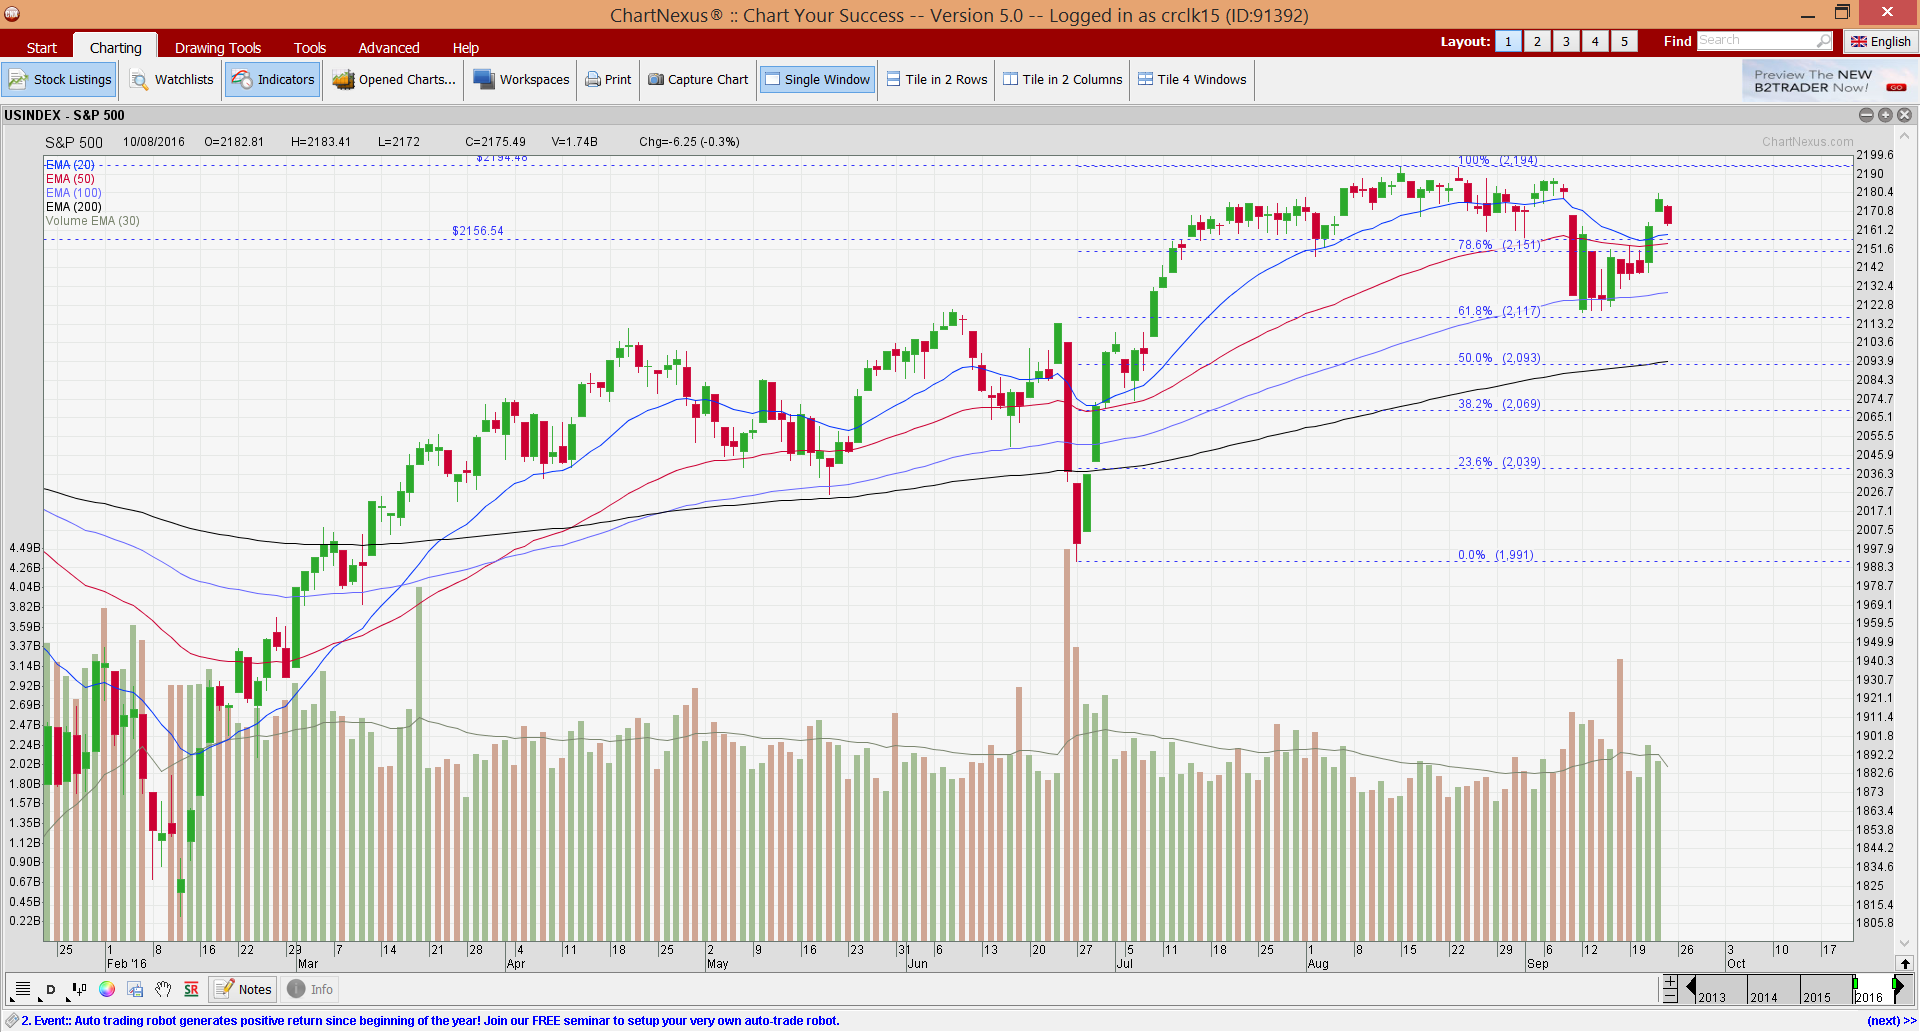
Source: Chartnexus chart as of 23 Sep 2016
Hang Seng Index
On 9 Sep 2016, I mentioned that “Hang Seng is pretty overbought with RSI closing at almost 80 on last Fri. This was the highest level since Apr 2015, before Hang Seng corrected. Other indicators such as MACD is also overbought, at levels last seen in May 2015. My personal view is that although the long term trend for Hang Seng is still up, it is likely to see some profit taking, especially with its elevated indicators.”
–> In line with expectations, Hang Seng fell 909 points from 24,100 on 9 Sep 2016 to an intraday low of 23,191 on 14 Sep 2016. Hang Seng closed at 23,686 on 23 Sep 2016.
Based on Chart 2 below, Hang Seng’s RSI has declined from 80 on 9 Sep 2016 to around 61 on 23 Sep 2016. Notwithstanding the profit taking, Hang Seng’s trend continues to be up, as depicted by its rising EMAs. OBV’s uptrend seems to be intact too. Hang Seng’s chart seems to be relatively stronger vis-à-vis our STI.
Near term supports: 23,357 – 23,400 / 23,200 / 22,780
Near term resistances: 23,916 / 24,135 / 24,364
Chart 2: Hang Seng uptrend intact despite mild profit taking
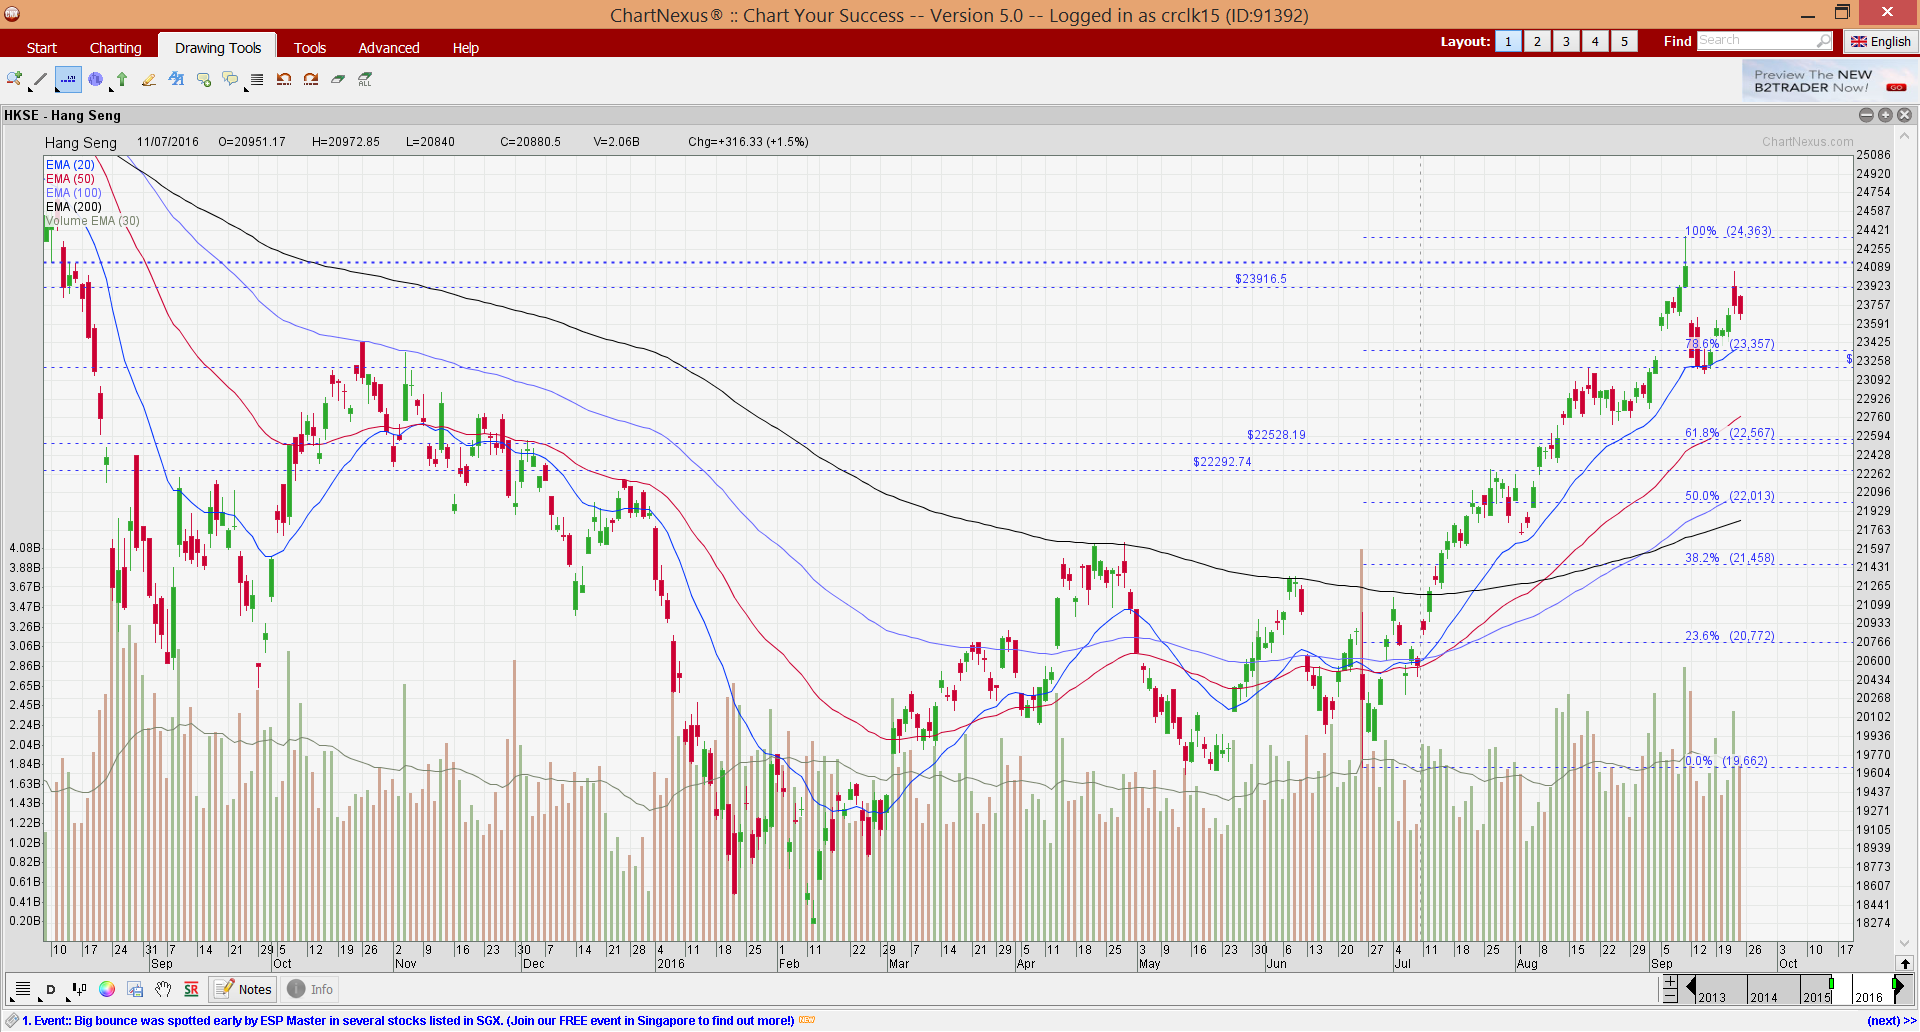
Source: Chartnexus chart as of 23 Sep 2016
STI Index
On 9 Sep 2016, I wrote that “Indicators such as RSI, MACD and MFI are nowhere near overbought levels. Although all the EMAs seem to be turning upwards, it is too early to view it as an uptrend. Amid the low ADX, my view is that STI is likely to trade within a range of 2,796 – 2,911. A sustained break below 2,796 is bearish for the chart.”
–> STI indeed touched an intraday low of 2,791 on 15 Sep 2016 but rebounded and closed at 2,857 on 23 Sep 2016.
Based on Chart 3 below, ADX continues to decline from 15 on 9 Sep 2016 to 12 on 23 Sep 2016, indicative of a lack of trend. STI’s EMAs are either flat or slightly declining. However, due to the low ADX, I place less weightage on the EMAs as they work better in trending markets. Amid the low ADX, my view is that STI is likely to trade within a range of 2,791 – 2,911. A sustained break below 2,791 is bearish for the chart.
Near term supports: 2,827 – 2,831 / 2,810 / 2,800
Near term resistances: 2,863 / 2,882 / 2,902 – 2,905
Chart 3: May trade within 2,791 – 2,911 amid low ADX
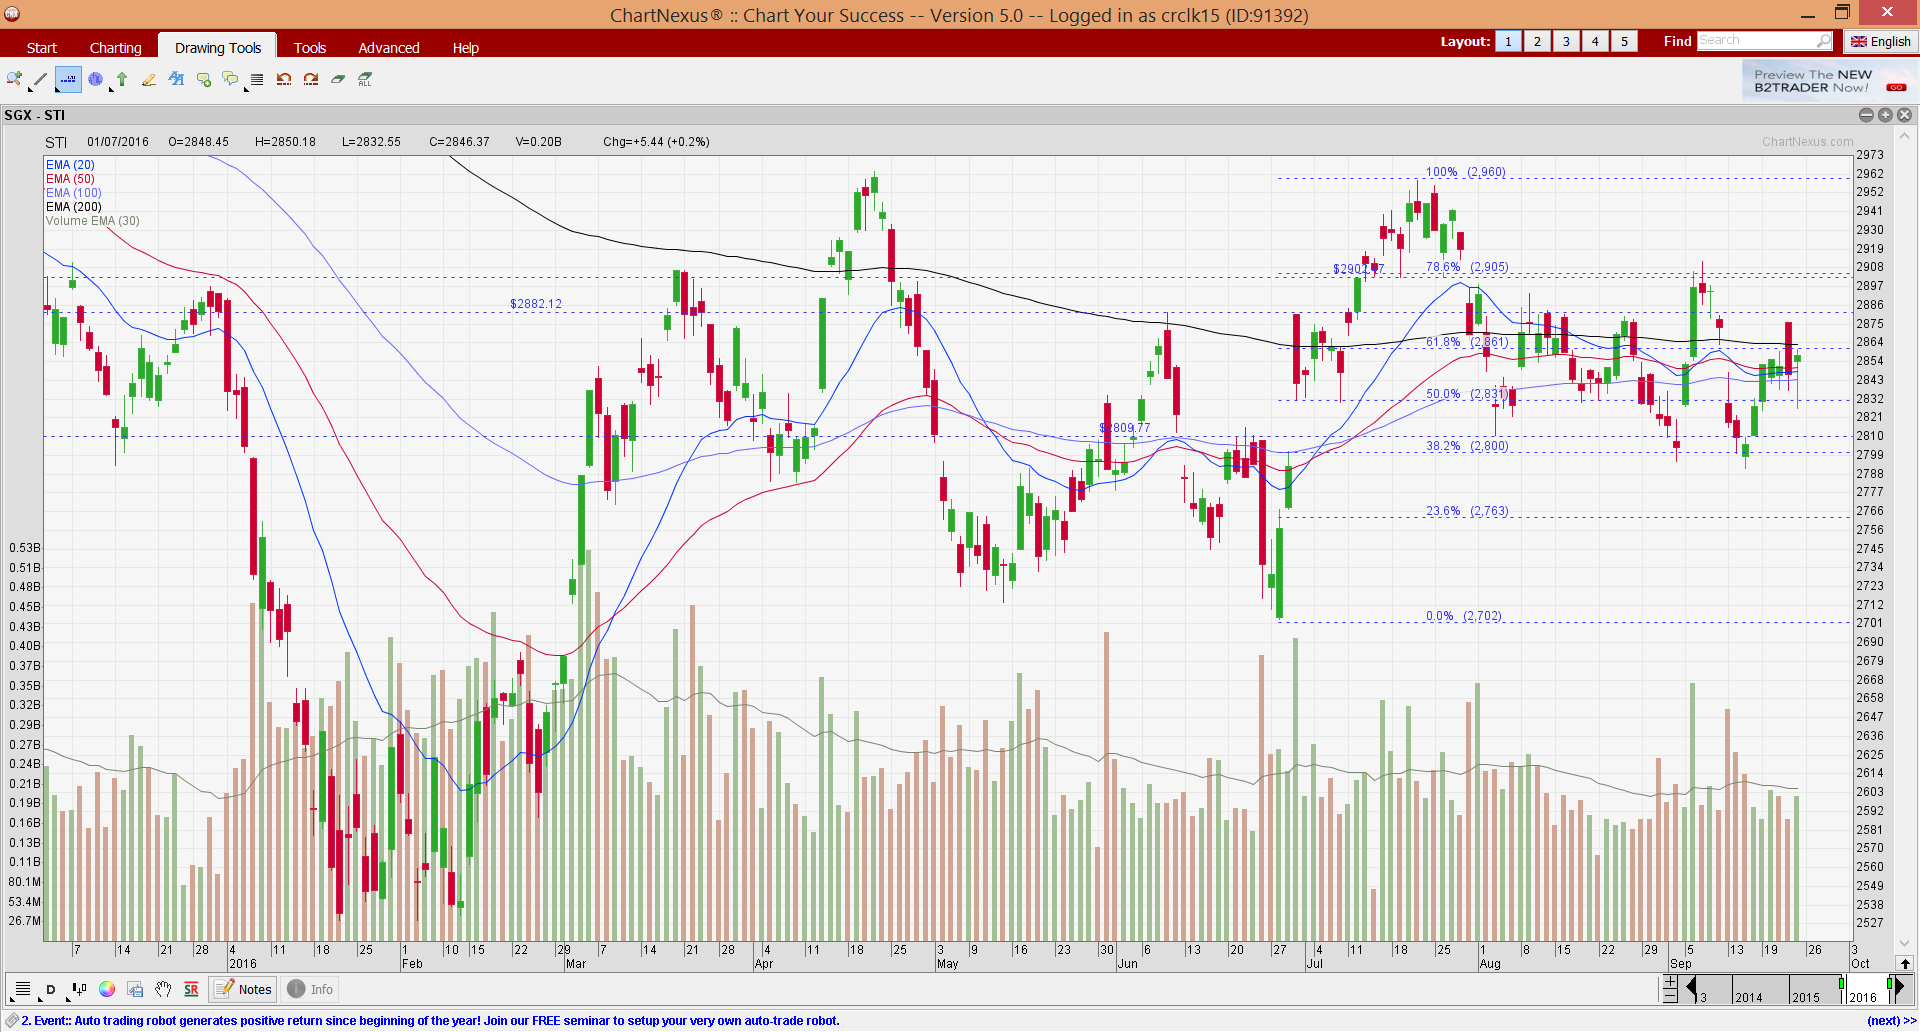
Source: Chartnexus chart as of 23 Sep 2016
FTSE ST Small Cap Index (“FSTS”)
As I have recently transited to Chartnexus, FSTS index is not available in their chart platform, thus I am not able to do any technical write-up on this.
Conclusion
With reference to my write-up on 9 Sep 2016 (see HERE), I wrote that I will likely raise my percentage invested from 62% on 9 Sep 2016 to accumulate certain stocks on weakness. Since 9 Sep, I have raised my percentage invested to around 70% before taking profit. I am currently around 55% invested in the market.
I have repeatedly mentioned in my past write-ups that I am wary of the general market post results. I have listed some of the write-ups here for your reference.
1. Ernest’s market outlook (9 Sep 16) Please click HERE
2. Caution ahead? Most market strategists think so… (26 Aug 2016) Please click HERE
Notwithstanding my cautious stance on the general market, I am positive on a handful of stocks with potential near term catalysts. As you are probably aware, I am of the view that there are still opportunities in our Singapore bourse, as long as we are diligent enough to uncover such companies. (My clients have, will & are informed on new stocks which I have entered and any significant portfolio change.)
Readers who wish to be notified of my write-ups and / or informative emails, can consider signing up at http://ernest15percent.com. However, this reader’s mailing list has a one or two-day lag time as I will (naturally) send information (more information, more emails with more details) to my clients first. For readers who wish to enquire on being my client, they can consider to leave their contacts here http://ernest15percent.com/index.php/about-me/
Lastly, many new clients have asked me how I screen and decide which companies to take a closer look / write. To understand more about my basis of deciding which companies to write, you can download a copy of my eBook available on my website HERE.
P.S: Do note that as I am a full time remisier, I can change my equity allocation fast to capitalize on the markets’ movements.
Disclaimer
Please refer to the disclaimer HERE