Dear readers,
Although my market outlook is a biweekly issue, the technical outlook for some technical indices has deteriorated and I view it timely to update my clients. See below.
S&P500 Index
Just to recap what I have mentioned on 7 Oct 2016 (see HERE), I wrote “all the exponential moving averages (“EMAs) are converging and trending higher. ADX has slipped from 22 on 23 Sep 2016 to 20 on 7 Oct 2016, indicative of a lack of trend. Indicators are neutral and stuck in a range. Although the trend continues to be an uptrend until proven otherwise, my personal view is that S&P500 is likely to trade 2,093 – 2,194 in the next two weeks with increasingly volatility.”
–> Since 7 Oct 2016, S&P500 dropped 19 points from 2,154 on 7 Oct 2016 to 2,133 (day low) on 14 Oct 2016.
Based on Chart 1 below, it is alarming to see that 21D and 50D exponential moving averages (“EMAs) are trending lower with 21D EMA forming a death cross with 50D EMA. 100D EMA started to turn flat and S&P500 closed below 100D EMA yesterday. It is noteworthy that S&P500 has not closed below its 100D EMA for three consecutive trading days since 1 Mar 2016. Thus, the price action around its 100D EMA is worth watching. Another bearish factor is that amid negatively placed directional indicator (“DI”) reading, ADX has risen from 20 on 7 Oct 2016 to 27 on 14 Oct 2016, indicative of a trend. A sustained break below 2,120 with volume points to an eventual measured technical target of 2,065. S&P500 has to make a sustained close above 2,157 with volume to negate the bearish tinge in the chart.
Near term supports: 2,120 / 2,115 / 2,102
Near term resistances: 2,144 / 2,154 – 2,157 / 2,176
Chart 1: S&P500 has turned bearish

Source: Chartnexus chart as of 14 Oct 2016
Hang Seng Index
On 7 Oct 2016, I mentioned that “Hang Seng seems to be consolidating its recent sharp gains by trading within a range 23,193 – 24,125. All its EMAs are rising which point to an uptrend. ADX has slid from around 36 on 23 Sep 2016 to 29 on 7 Oct 2016. RSI has declined from 61 on 23 Sep 2016 to around 57 on 7 Oct 2016. A break below 23,193 / above 24,125 points to an eventual measured technical target 22,261 / 25,057 respectively.”
–> Hang Seng touched an intraday low of 23,006 on 13 Oct 2016 before closing at 23,233 on 14 Oct 2016. For the past one week, Hang Seng has declined 619 points, or 2.6%.
Based on Chart 2 below, Hang Seng is trading dangerously close to its lower end of the trading range 23,193 – 24,125. 21D EMA has started to decline. 50D EMA is starting to turn flat. Although ADX has slid from 29 on 7 Oct 2016 to around 24 on 14 Oct 2016, the DIs have turned negative. A break below 23,193 / above 24,125 points to an eventual measured technical target 22,261 / 25,057 respectively.
Near term supports: 23,100 / 22,700 / 22,567
Near term resistances: 23,357 / 23,480 / 23,930
Chart 2: Hang Seng – testing its lower end of the trading range 23,193 – 24,125

Source: Chartnexus chart as of 14 Oct 2016
STI Index
On 7 Oct 2016, I wrote that “ADX continues to decline from 12 on 23 Sep 2016 to 10 on 7 Oct 2016, indicative of a lack of trend. STI’s EMAs are converging together. As mentioned previously, due to the low ADX, I place less weightage on the EMAs as they work better in trending markets. Indicators are mixed but some indicators such as OBV and RSI are showing some bearish divergences. Amid the low ADX, I reiterate my view that STI is likely to trade within a range of 2,791 – 2,911. A sustained break below 2,791 / above 2,911 points to an eventual measured technical target of 2,671 / 3,031 respectively.”
–> STI slid 60 points or 2.1% for the week amid weakness in the banks and telcos.
Based on Chart 3 below, amid negatively ADX has halted its decline and started to rise from 10 on 7 Oct 2016 to 14 on 14 Oct 2016. This still indicates that there is a lack of trend but the increase is noteworthy, coupled with negatively placed DIs. All the EMAs are declining with 21D EMA pulling apart from 200D EMA after converging. Indicators are mixed but some indicators such as OBV and RSI are showing some bearish divergences. My personal view is that STI may not be able to have a sustained close above its strong near term resistance of around 2,845 – 2,865. A sustained break below 2,791 / above 2,911 points to an eventual measured technical target of 2,671 / 3,031 respectively.
Near term supports: 2,791 / 2,784 / 2,763
Near term resistances: 2,831 / 2,845 / 2,865
Chart 3: Strong near term resistance 2,845 – 2,865
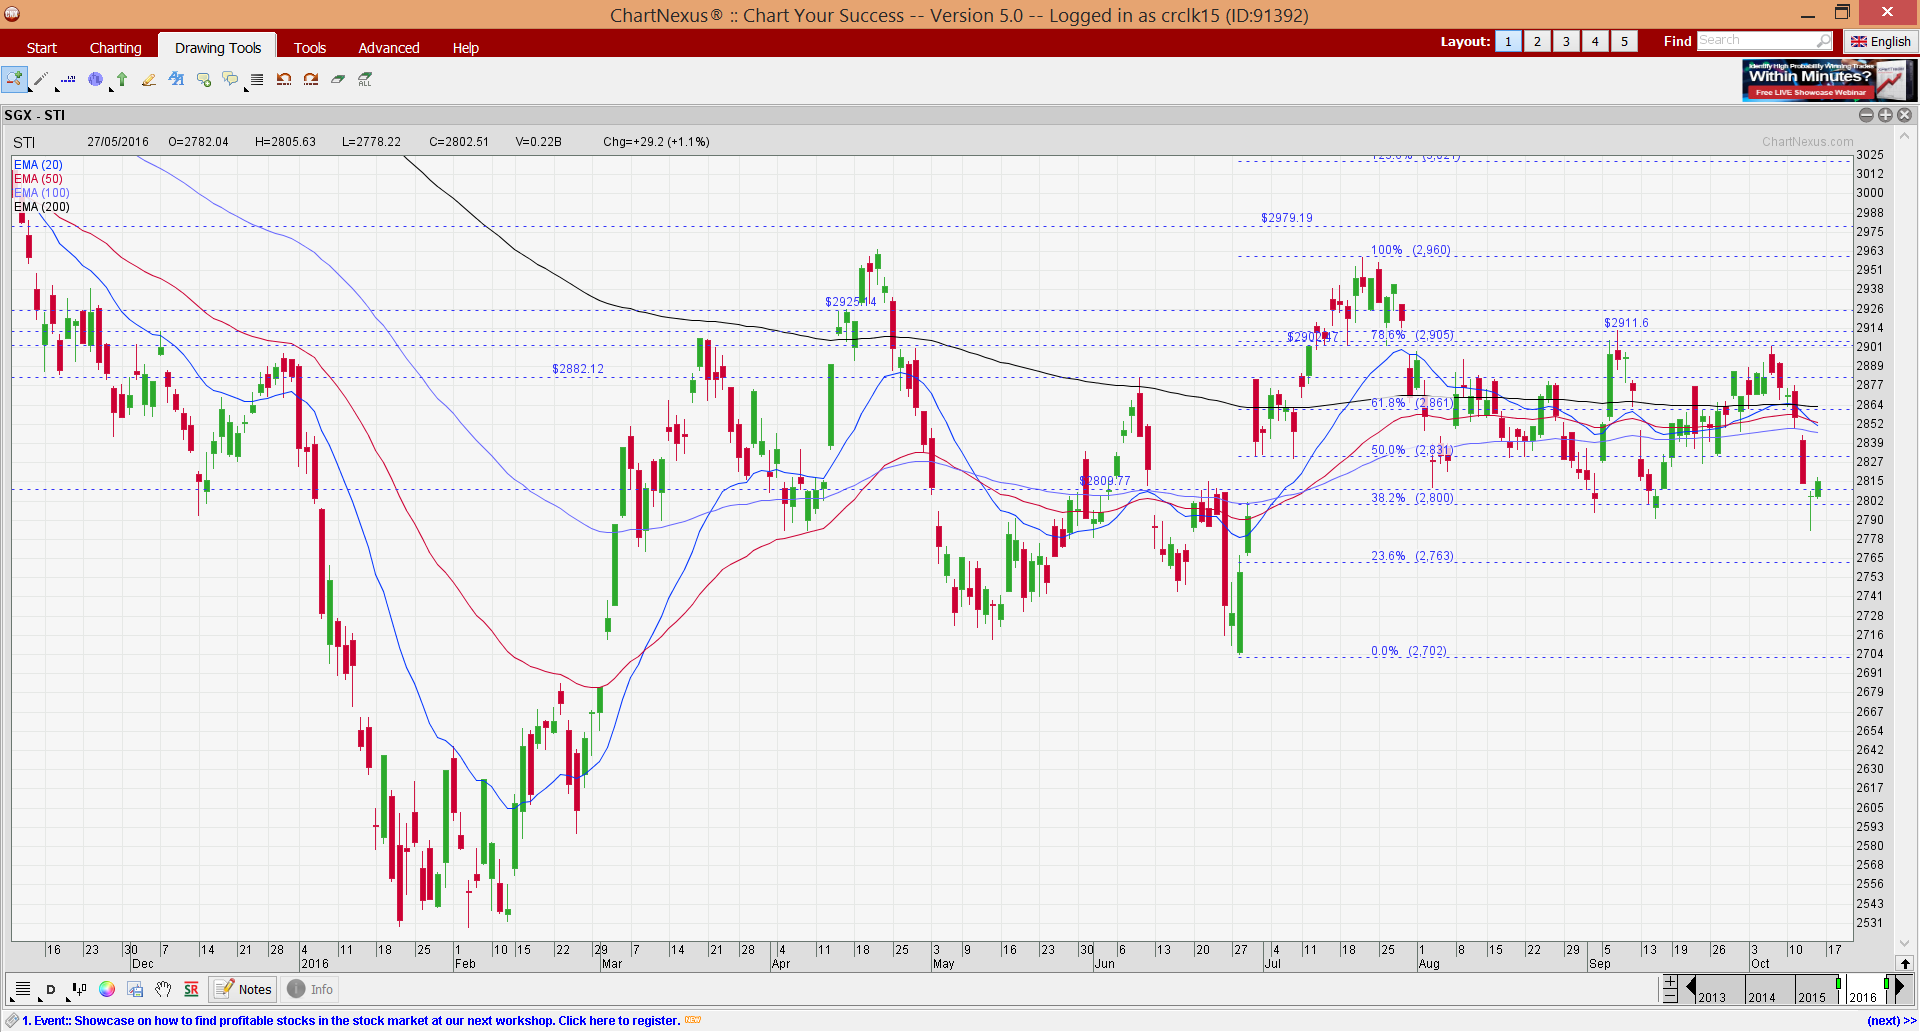
Source: Chartnexus chart as of 14 Oct 2016
Conclusion
With reference to my write-up on 7 Oct 2016 (see HERE), I wrote that I continued to be cautious on the general market, while remain positive on selective stocks. Since 7 Oct 2016, I have rebalanced my portfolio as some stocks have risen sharply whereas other stocks have started to dip after rising. I have increased my overall equity allocation from 24% as on 7 Oct 2016 to around 35% on 14 Oct 2016. In the next two weeks, although I am increasing cautious on the general market, I remain ready to accumulate some small mid cap stocks with potential near term catalysts.
As I have been pretty active in trading last week, my positions change frequently. (I will inform my clients on my portfolio next week when the positions are more static.)
Besides my technical views on the indices above, you can refer to some of the write-ups here on why I am bearish on the general markets.
a) Ernest’s market outlook 7 Oct 2016 (see HERE);
b) HSBC: There’s Now a Very High Chance of a ‘Severe Fall’ In U.S. Stocks –> Bloomberg 12 Oct 16 (click HERE);
c) The stock market is turning into a sloppy, ugly mess—and it could get worse –> Marketwatch 14 Oct 16 (click HERE)
Readers who wish to be notified of my write-ups and / or informative emails, can consider signing up at http://ernest15percent.com. However, this reader’s mailing list has a one or two-day lag time as I will (naturally) send information (more information, more emails with more details) to my clients first. For readers who wish to enquire on being my client, they can consider to leave their contacts here http://ernest15percent.com/index.php/about-me/
Lastly, many new clients have asked me how I screen and decide which companies to take a closer look / write. To understand more about my basis of deciding which companies to write, you can download a copy of my eBook available on my website HERE.
P.S: Do note that as I am a full time remisier, I can change my equity allocation fast to capitalize on the markets’ movements.
Disclaimer
Please refer to the disclaimer HERE