Dear readers,
Notwithstanding most experts’ dire predictions that Dow may plunge as much as 10% on Trump’s win, Dow closed at a record high AFTER Trump’s win!
Read on for more.
S&P500 Index
Just to recap what I have mentioned on 28 Oct 2016 (see HERE), I wrote “S&P500 closed below 100D EMA (currently 2,136) yesterday. As mentioned previously, S&P500 has not closed below its 100D EMA for three consecutive trading days since 1 Mar 2016. Thus, the price action around its 100D EMA is worth watching. After forming a death cross, 21D EMA is moving apart from 50D EMA which is another negative trait. A more alarming factor is that, amid negative placed DIs, ADX has risen from 27 on 14 Oct 2016 to 29 on 28 Oct 2016, indicative of a trend. A sustained break below 2,120, followed by a break below its 200D EMA (currently around 2,105) is very bearish and points to an eventual measured technical target of 2,065. S&P500 has to make a sustained close above 2,157 with volume to negate the bearish tinge in the chart”
–> In line with expectations, S&P500 was indeed weaker and dropped 41 points, or 1.9% from 2,126 on 28 Oct 2016 to 2,085 on 4 Nov 2016.
On 3 & 4 Nov 2016, I have informed my clients that S&P500 typically rebounds when its RSI touches 27 – 32. As of 4 Nov, S&P500 RSI closed around 29 on 3 Nov. I have also mentioned that as my eventual technical target is around 2,065 vs 3 Nov close of 2,089, there seems to be limited potential downside. For those clients who wish to build up their blue-chip portfolios over time, they can consider accumulating on weakness.
–> The 2,085 level on 4 Nov was coincidentally the near-term low for S&P500. It subsequently rebounded 79 points, or 3.8% to 2,164 on 11 Nov 2016.
Based on Chart 1 below, S&P500, after closing below its 100D exponential moving average (“EMA”) for six consecutive days, surged with volume and closed above its 100D EMA (currently 2,137) for five consecutive days. 21D EMA has just formed a golden cross with 50D EMA on 10 Nov 2016. Another positive feature is that the directional indicators (“DIs”) have turned positive with ADX closing at 28. S&P500 has closed above 2,157 for three consecutive days. Although time is required to observe whether the golden cross is sustainable and whether S&P500 can continue to close above 2,157, S&P500’s chart looks more positive than two weeks ago. My personal view is that the bearish tinge which has clouded the S&P500 chart has been negated.
Near term supports: 2,151 – 2,157 / 2,144 / 2,134 – 2,137
Near term resistances: 2,168 / 2,176 – 2,180 / 2,195
Chart 1: A sustained close above 2,157 with volume negates the bearish tinge in the chart
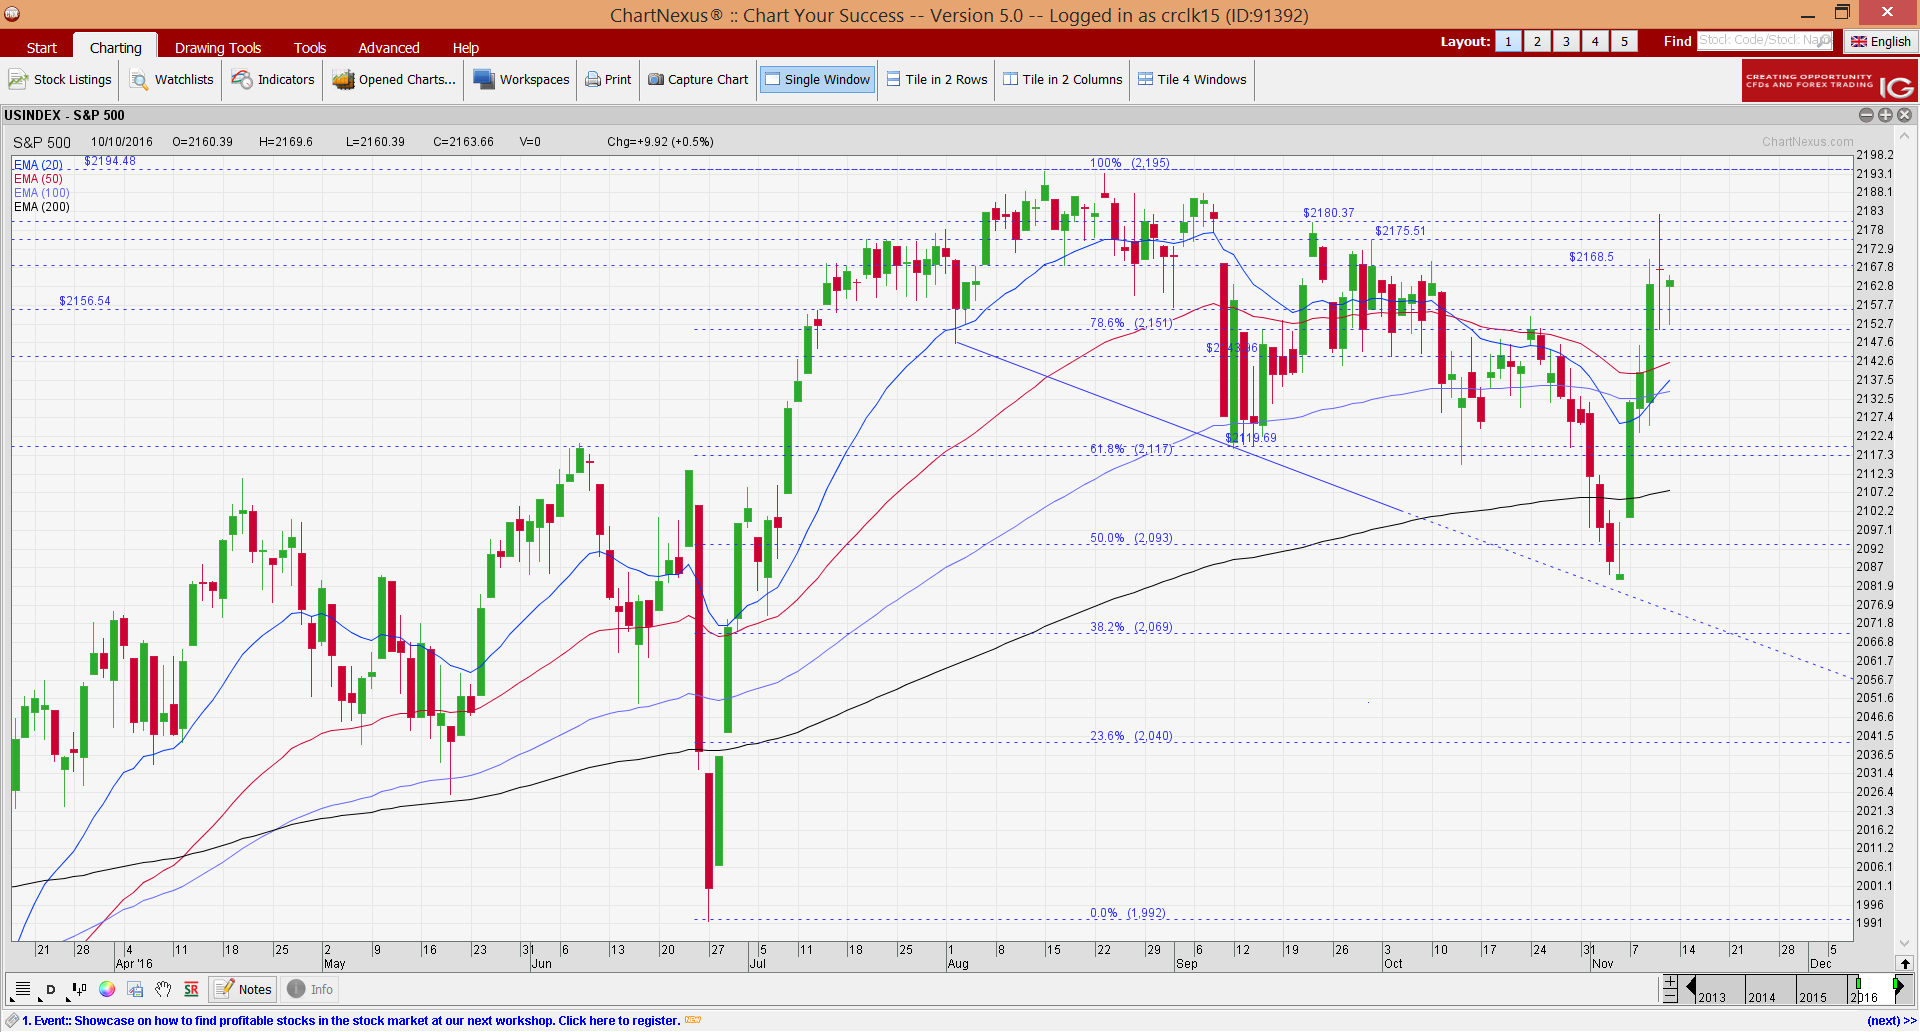
Source: Chartnexus chart as of 11 Nov 2016
Hang Seng Index
On 28 Oct 2016, I mentioned that “Hang Seng closed below its trading range 23,193 – 24,125 for a second consecutive day. It also closed below its 50D EMA for the second consecutive day. 21D EMA continues to decline with 50D EMA turning flat. Amid negatively placed DIs, ADX has started to rise from 16 on 26 Oct 2016 to 19 on 28 Oct 2016. Although ADX is still below 20, the increase is significant. A sustained break below 23,193 / above 24,125 points to an eventual measured technical target 22,261 / 25,057 respectively.”
–> Since 28 Oct 2016, Hang Seng dropped almost 1,000 points from 22,955 on 28 Oct 2016 to touch an intraday low of 21,958 on 9 Nov 2016, thereby meeting my eventual measured technical target 22,261. It subsequently closed at 22,531 on 11 Nov 2016.
Based on Chart 2 below, Hang Seng’s 21D EMA has formed a death cross with 50D EMA on 9 Nov 2016. ADX has risen from 19 on 28 Oct 2016 to close at 28 on 11 Nov 2016, amid negatively placed DIs. Indicators such as OBV and MFI continue to decline. Hang Seng’s chart seems to be weaker that S&P500 chart on a relative basis.
Near term supports: 22,378 / 22,232 / 21,856 – 21,890
Near term resistances: 22,622 / 22,700 / 22,960 – 23,027
Chart 2: Hang Seng seems weaker than S&P500
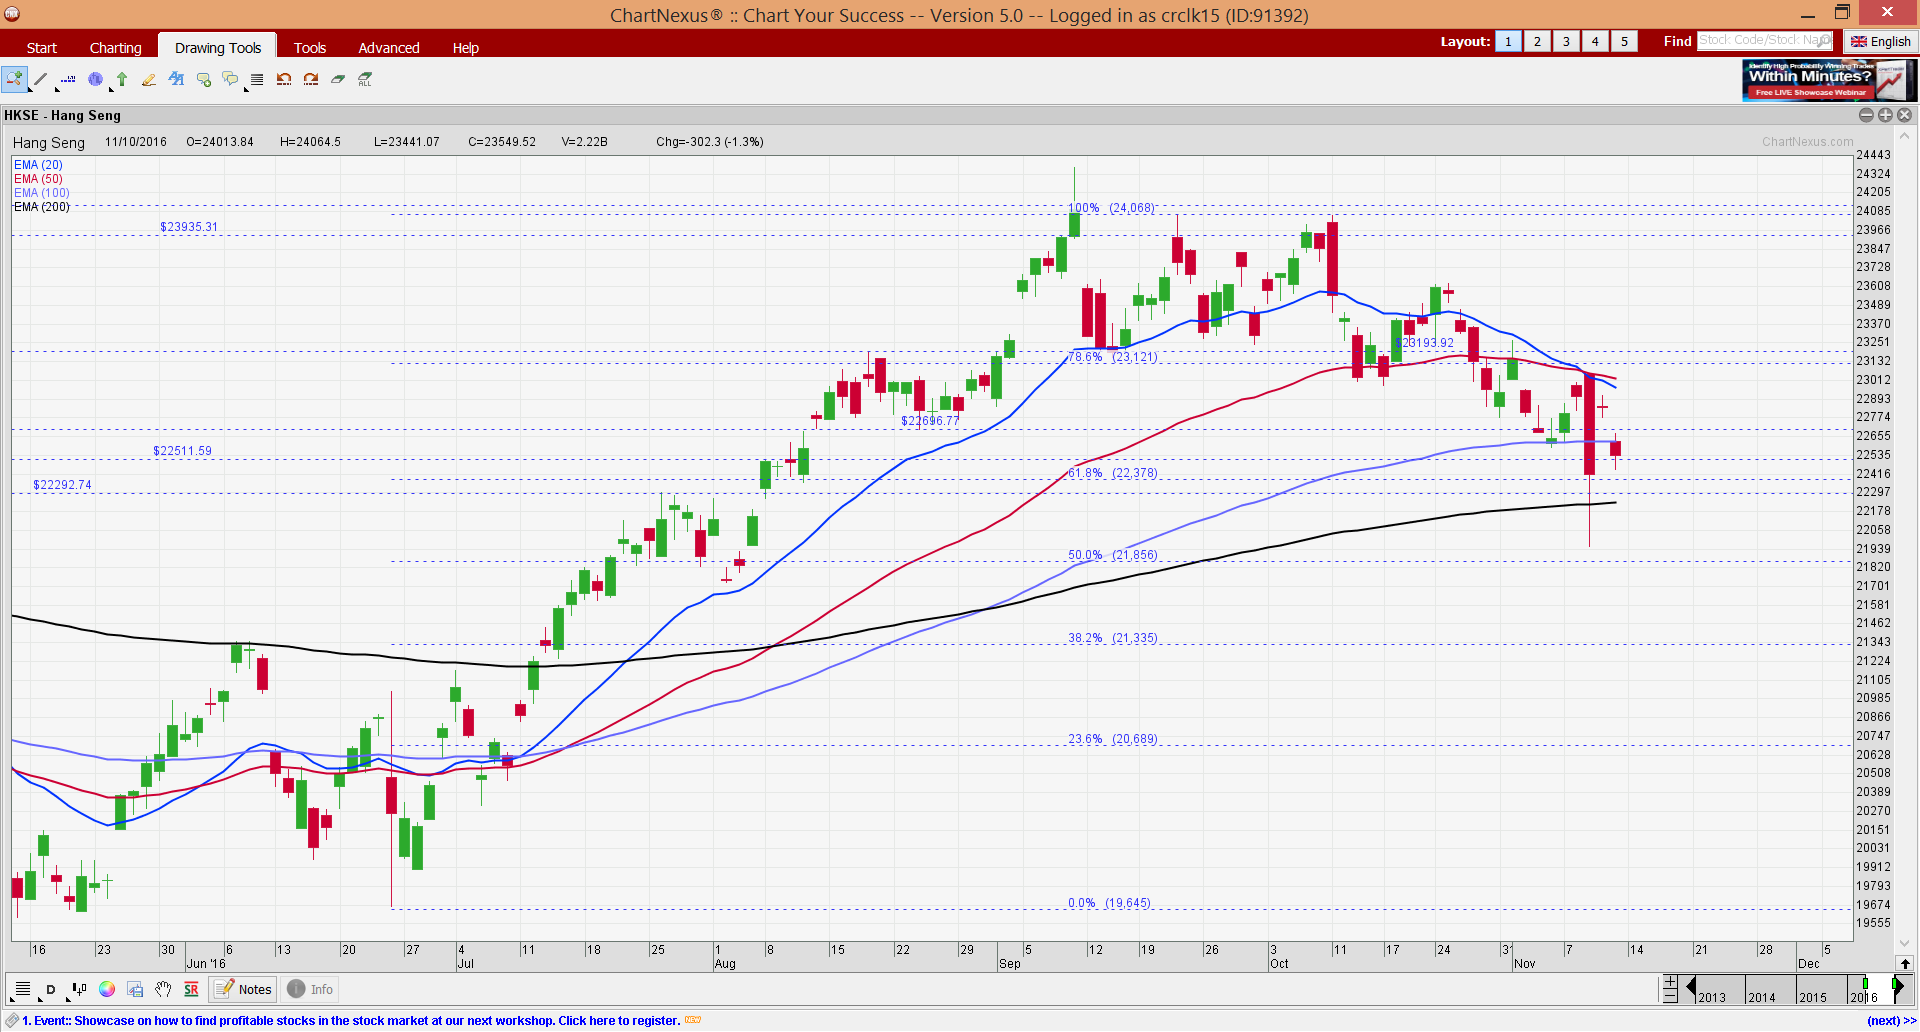
Source: Chartnexus chart as of 11 Nov 2016
STI Index
On 28 Oct 2016, I wrote that “Amid the low ADX, there is a lack of trend which may explain why STI movement has not been huge since Sep 2016. 21D EMA has formed death crosses with 200D EMA, 100D and 50D EMA. However, with the weak ADX, it is likely that STI may continue to trade within 2,781 – 2,911. My personal view is that STI may not be able to have a sustained close above its strong near term resistance of around 2,840 – 2,860. Nevertheless, with the weak ADX, STI may not have a large sustained fall in the next 1-2 weeks. A sustained break below 2,781 / above 2,911 points to an eventual measured technical target of 2,650 / 3,040 respectively.”
–> This was spot on in various aspects.
a) STI did not fluctuate much vis-à-vis the other indices. STI closed 1 point lower from 2,816 on 28 Oct 2016 to 2,815 on 11 Nov 2016. This was remarkable despite the U.S. election;
b) During the turmoil on 9 Nov 2016, STI only touched an intraday low of 2,761 before closing 2,790 on the same day. In other words, STI continued to trade within my previously mentioned range of 2,781 – 2,911.
c) STI touched an intraday high of 2,840 on 10 Nov 2016 before closing at 2,815 on 11 Nov 2016. i.e. STI did not manage to have a sustained close above its strong near term resistance of around 2,840 – 2,860
Based on Chart 3 below, amid the negatively placed DIs, ADX has risen from 15 on 28 Oct 2016 to 22 on 11 Nov 2016. It is noteworthy that ADX closed at the highest level since Aug 2016. There seems to be some indication of a trend. All the EMAs are sliding. Indicators such as OBV, RSI and MACD have not shown any bullish divergences. My personal view is that the current chart outlook is not clear but it is laced with a small tinge of bearishness. The chart will be clearer if STI makes a sustained close above 2,860, or make a sustained close below 2,781. A sustained break below 2,781 / above 2,911 points to an eventual measured technical target of 2,650 / 3,040 respectively. All in, I believe STI’s volatility is likely to rise in the next few weeks and may trade between 2,760 – 2,911.
Near term supports: 2,800 / 2,791 / 2,780
Near term resistances: 2,831 / 2,839 / 2,855 – 2,860
Chart 3: Key support / resistance at 2,781 & 2,860 respectively

Source: Chartnexus chart as of 11 Nov 2016
Conclusion
With reference to my write-up on 28 Oct 2016 (see HERE), I wrote that “I am cognizant that the U.S. Election may be a market moving event, I do not waste precious time in predicting the outcome and the subsequent market reaction as I am well aware of my limitations in such predictions. (I prefer to use my time to research and spot stocks with potential near term catalysts and position my portfolio accordingly)”
Most market pundits did not expect a Trump Win. Furthermore, most of them estimated that the U.S. market is likely to tumble with a Trump win. Some went as far as predicting an immediate 10% drop in Dow, should Trump win. The market surprised on two fronts. Firstly, Trump won the Presidential Election. Dow futures initially tumbled on this surprise win during Asian hours but closed at a record high on last Fri.
My percentage invested continues to be around the same level at around 89-90% invested. I can easily raise my equity allocation to 150-200% with the help of CFD. I.e. I can still buy on weakness especially on certain blue chips if they become severely oversold.
The reit sector, as measured by the FTSE ST Real Estate Investment Trust fell 3.1% from an intraday high of 741.9 on 9 Nov 2016 to an intraday low of 719.0 on 11 Nov 2016. This was mainly attributed to rising interest rate expectations and a spike in bond yields. As a whole, the reits are currently trading approximately 450bps above 10 year Singapore government securities and less than 1.0x P/BV. Based on such metrics and my view that the Fed is likely to continue their measured / accommodative pace of rate hike, reits seem to be attractive. I have done a personal compilation of reits / business trusts using Bloomberg data as of 11 Nov 2016 and will be sending the entire list to my clients and readers on my website signup list. I have appended the top 3 reits / business trusts sorted by total potential return in Table 1 for your reference.
Table 1: Top 3 reits / business trusts sorted by total potential return
![]()
Source: Bloomberg as of 11 Nov 2016
*Please note that the information is sourced from Bloomberg. I have not checked the accuracy of the above data. They do not form any specific “buy, sell, hold” recommendation.
**Readers who wish to receive the full list can consider to sign up on my website signup list HERE.
Readers who wish to be notified of my write-ups and / or informative emails, can consider signing up at http://ernest15percent.com. However, this reader’s mailing list has a one or two-day lag time as I will (naturally) send information (more information, more emails with more details) to my clients first. For readers who wish to enquire on being my client, they can consider to leave their contacts here http://ernest15percent.com/index.php/about-me/
Lastly, many new clients have asked me how I screen and decide which companies to take a closer look / write. To understand more about my basis of deciding which companies to write, you can download a copy of my eBook available on my website HERE.
P.S: Do note that as I am a full time remisier, I can change my equity allocation fast to capitalize on the markets’ movements.
Disclaimer
Please refer to the disclaimer HERE
I am interested in more information. How can I contact you?