Dear readers,
STI has hit highs last seen on Apr and Jul 2016, powered by our local banks. Can this sustain?
Read on for more.
S&P500 Index
Just to recap what I have mentioned on 25 Nov 2016 (see HERE), I wrote “S&P500 is on a clear uptrend. All the exponential moving averages (“EMAs”) are rising with 21D EMA forming golden cross with 50D EMA on 10 Nov 2016. Amid positive placed directional indicators (“DIs”), ADX continues to move higher from 28 on 11 Nov 2016 to 31 on 25 Nov 2016. It is noteworthy that indicators such as RSI, MACD and OBV have not hit new highs with price, thus there may be some bearish divergence. Furthermore, RSI closes at 71 on 25 Nov 2016, near a two-year high since Nov 2014. Thus, there is a possibility that near-term potential upside may be limited to around 2,225 – 2,250 before some consolidation or profit taking sets in.”
–> S&P500 powers ahead to close at 2,260 on 9 Dec 2016, a record high.
Based on Chart 1 below, S&P500 is on a clear uptrend amid rising EMAs. ADX continues to rise from 31 on 25 Nov 2016 to 36 on 9 Dec 2016 on the backdrop of positive placed directional indicators (“DIs”). RSI closed around 77 on 9 Dec 2016. This is overbought and at a 3-year high. Indicators such as OBV, MACD and MFI continue to exhibit bearish divergence with price. Although bearish divergences can continue for some time, it is a cause of concern. My personal view is that S&P500 may consolidate its heady gains in the next two weeks with near term potential upside capped around 2,275.
Near term supports: 2,241 / 2,215 / 2,205
Near term resistances: 2,275 / 2,300 / 2,325
Chart 1: S&P500 potential upside capped around 2,275, likely to consolidate in the next 2 weeks

Source: Chartnexus chart as of 9 Dec 2016
Hang Seng Index
On 25 Nov 2016, I mentioned that “Hang Seng is in a short-term downtrend since 11 Oct 2016. Hang Seng’s 21D EMA has formed a death cross with 50D EMA on 9 Nov 2016. Amid negatively placed DIs, ADX has risen from 28 on 11 Nov 2016 to 34 on 25 Nov 2016, indicative of a trend. Hang Seng seems to be testing the downtrend line established since 11 Oct 2016. A sustained break above 22,840 will ameliorate the bearishness of the chart. Only a sustained close above 23,200 is positive for the chart.”
–> Hang Seng closed 0.2% higher from 22,723 on 25 Nov 2016 to 22,761 on 9 Dec 2016.
Based on Chart 2 below, after falling from an intraday high of 24,065 on 11 Oct 2016, Hang Seng has been range trading between 22,290 – 23,060 for the past month. Amid negatively placed DIs, ADX has declined from 34 on 25 Nov 2016 to 22 on 9 Dec 2016. A sustained break above 23,060 will ameliorate the bearishness of the chart. Only a sustained close above 23,200 is positive for the chart. A sustained break below 22,290 is bearish for the chart.
Near term supports: 22,512 / 22,416 / 22,290
Near term resistances: 22,810 / 23,060 / 23,160 – 23,200
Chart 2: Key levels to watch: 22,290 & 23,200
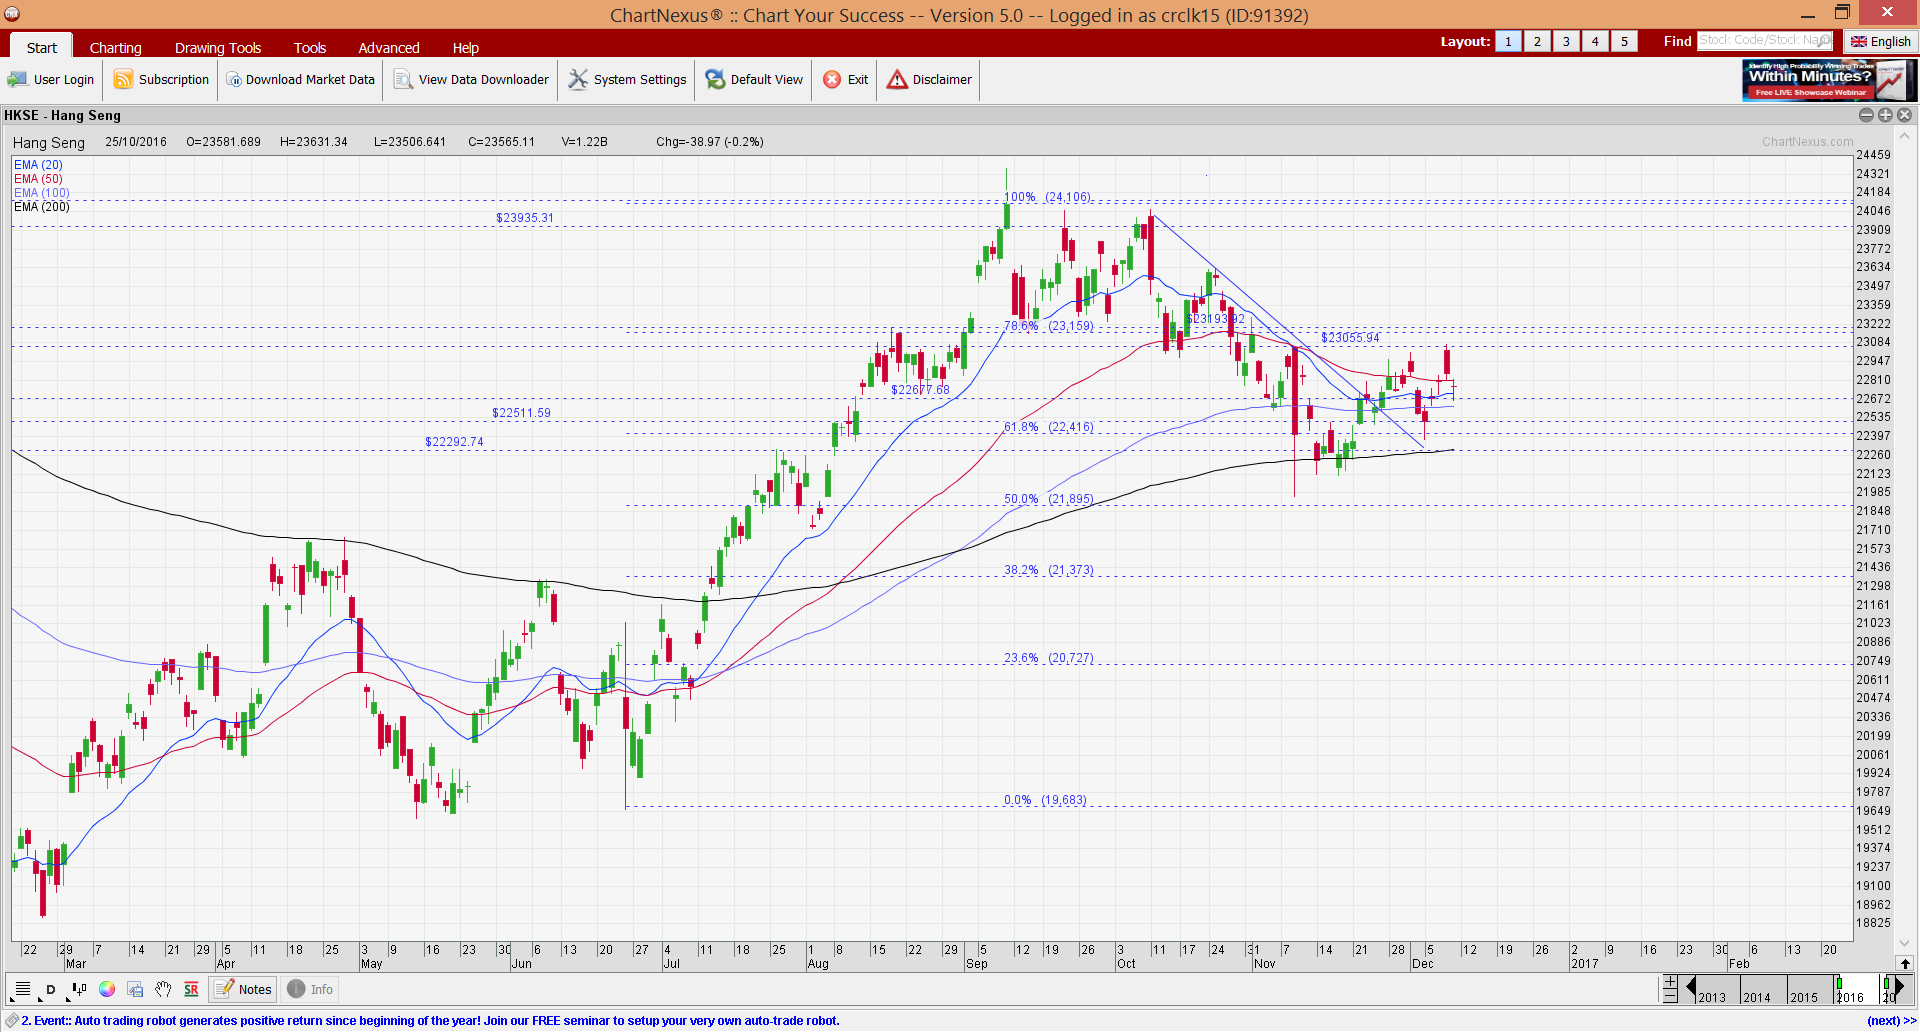
Source: Chartnexus chart as of 9 Dec 2016
STI Index
On 25 Nov 2016, I wrote that “ADX is still negatively placed, and has slightly risen from 22 on 11 Nov 2016 to 23 on 25 Nov 2016. 21D, 50D and 100D EMA seem to have stopped their declines and are inching upwards. STI has just closed above its 200D EMA, the first time in 1 ½ months. Indicators such as RSI, MACD and OBV are strengthening. As previously highlighted, if STI can make a sustained close above 2,860, the bearish tinge in the chart will be negated. A more positive signal will appear if it can make a sustained close above 2,911. A sustained break below 2,781 / above 2,911 points to an eventual measured technical target of 2,650 / 3,040 respectively.”
–> With the help of the banks, STI breached 2,911 on 1 Dec 2016 and closed at 2,956 on 9 Dec 2016, up 3.4% since 25 Nov 2016.
Based on Chart 3 below, STI is on a clear uptrend with all its EMAs rising. The EMAs also formed golden cross formations. Amid positively placed DIs, ADX has risen from 23 on 25 Nov 2016 to 26 on 9 Dec 2016, indicative of a trend. However, in the near term, STI seems to have rallied too much and the likelihood of a retracement (i.e. profit taking or consolidation but likely not a trend reversal) is high. STI’s RSI closed at 72 on 9 Dec 2016. Since May 2015, there is usually profit taking when STI reaches 70 or more. Indicators such as MACD and OBV are exhibiting bearish divergences.
Notwithstanding the possible retracement, if there is no sustained break below 2,860, the break above 2,911 points to an eventual measured technical target of 3,040.
Near term supports: 2,941 – 2,943 / 2,925 / 2,911
Near term resistances: 2,960 / 2,976 / 3,000
Chart 3: Probability of profit taking or consolidation is high

Source: Chartnexus chart as of 9 Dec 2016
Conclusion
For the past two weeks, I have taken profit on some trading positions in certain small caps and reduce my percentage invested to around 88% on 9 Dec 2016. As previously highlighted, I intended to initiate some short trades via CFDs which I have done so over the past two weeks. As a result, my net exposure is around 54%.
My personal view is that the U.S. market may be due for at least some consolidation, or mild profit taking in the near term because
a) According to an article on Marketwatch, U.S. stocks hit 27.9x based on cyclically-adjusted price to earnings ratio, or CAPE. Such high PE was last seen in 2002 — just before stocks tumbled. This level was also seen just before the crash of 1929, and was far higher than was seen in 2007. Please refer to HERE for more information on CAPE.
b) According to Jason Goepfert, president of Sundial Capital, he said that 73% of the S&P 500 financial sector hit 52-week highs on 8 Dec 2016, the most since Feb. 13, 1997, and the second highest percentage since 1990. Based on the five largest surges in 52 week high in the financials (See Chart 4), the financials posted a median loss of 1.9% and 2.5% in the subsequent one week and two weeks respectively. Please refer to HERE for more information
Chart 4: 73% of the S&P 500 financial sector hit 52-week highs on 8 Dec 2016
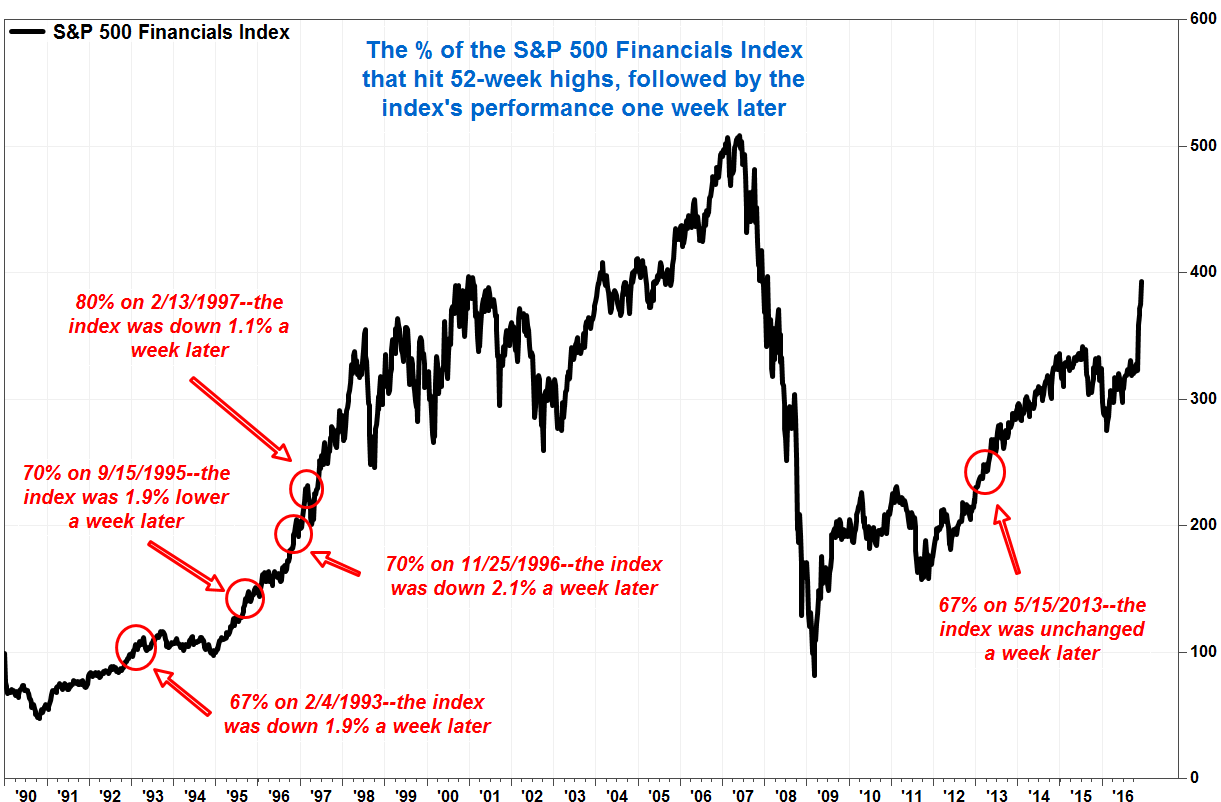
Source: Marketwatch, Sundial Capital
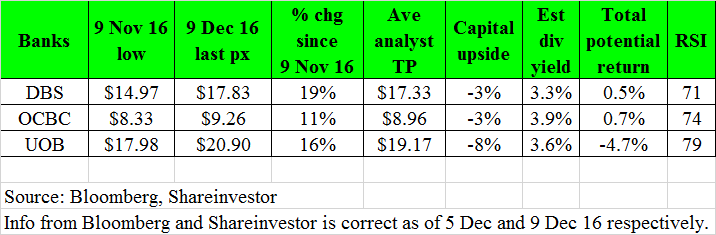
For our Singapore market, as previously mentioned to my clients last week, our Singapore banks have rallied too much in a short span of time. Thus, there may be scope for some profit taking. Furthermore, they have mostly exceeded average analyst target prices. See Table 1 below.
Table 1: Bank analysis vs average analyst target prices
As I have previously mentioned before, everybody is different thus, the percentage invested should differ per your risk profile, return expectation, market outlook, investment horizon, commitments etc. Readers should be aware of the following events in the next few weeks:
Readers who wish to be notified of my write-ups and / or informative emails, can consider signing up at http://ernest15percent.com. However, this reader’s mailing list has a one or two-day lag time as I will (naturally) send information (more information, more emails with more details) to my clients first. For readers who wish to enquire on being my client, they can consider to leave their contacts here http://ernest15percent.com/index.php/about-me/
Lastly, many new clients have asked me how I screen and decide which companies to take a closer look / write. To understand more about my basis of deciding which companies to write, you can download a copy of my eBook available on my website HERE.
P.S: Do note that as I am a full time remisier, I can change my equity allocation fast to capitalize on the markets’ movements.
Disclaimer
Please refer to the disclaimer HERE