Dear readers,
Two weeks ago, I mentioned that there is likely to be profit taking on the STI. STI has since fallen 85 points, or 2.9%. What lies ahead?
S&P500 Index
Just to recap what I have mentioned on 9 Dec 2016 (see HERE), I wrote “S&P500 is on a clear uptrend amid rising EMAs and ADX, on the backdrop of positive placed directional indicators (“DIs”). RSI closed around 77 on 9 Dec 2016. This is overbought and at a 3-year high. Indicators such as OBV, MACD and MFI continue to exhibit bearish divergence with price. Although bearish divergences can continue for some time, it is a cause of concern. My personal view is that S&P500 may consolidate its heady gains in the next two weeks with near term potential upside capped around 2,275.”
–> S&P500 touched an intraday high of 2,278 on 13 Dec 2016 but closed at 2,264 on 23 Dec 2016. S&P500 managed a marginal 4-point climb for the past two weeks.
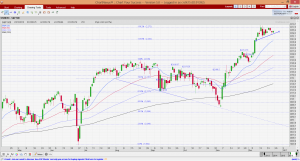
Based on Chart 1 below, S&P500 is consolidating its gains for the past two weeks. It continues to be on a clear uptrend amid rising EMAs. ADX continues to rise from 36 on 9 Dec 2016 to 39 on 23 Dec 2016 on the backdrop of positive placed DIs. As S&P500 consolidates, most indicators such as RSI, MACD and OBV have softened. For example, RSI slid from 77, a near 3 year over bought level on 9 Dec 2016 to 67 on 23 Dec 2016. My personal view is that S&P500 may trade within the range of 2,241 – 2,300 in the next one week. A sustained break below 2,241 with volume expansion has an eventual measured technical target of 2,212. S&P500 should see more activity and volume when the fund managers come back for work in the 1st week of January 2017.
Near term supports: 2,258 / 2,241 / 2,215
Near term resistances: 2,275 / 2,300 / 2,325
Chart 1: S&P500 consolidating its gains for the past two weeks
Source: Chartnexus chart as of 23 Dec 2016
Hang Seng Index
On 9 Dec 2016, I mentioned that “Key levels to watch are 22,290 & 23,200. A sustained break above 23,060 will ameliorate the bearishness of the chart. Only a sustained close above 23,200 is positive for the chart. A sustained break below 22,290 is bearish for the chart.”
–> As mentioned above, a break below 22,290 is bearish for Hang Seng. Hang Seng tumbled 1,186 points or 5.2% in the past two weeks to close 21,575 on 23 Dec 2016.
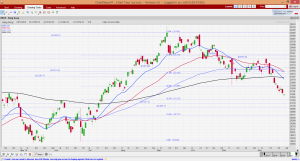
Based on Chart 2 below, Hang Seng chart is on a downtrend. All three EMAs (20D, 50D and 100D) are falling and 200D EMA is starting to decline. 20D EMA has formed a death cross with 200D EMA on 22 Dec 2016. 50D EMA and 100D seem to be forming a death cross too. Amid negatively placed DIs, ADX resumed its climb from 22 on 9 Dec 2016 to 28 on 23 Dec 2016. This is indicative of a trend. The break below 22,290 points to an eventual technical target of around 21,388.
A saving grace to this down trending Hang Seng is that RSI has dropped to an oversold level of 29 which is the lowest level last seen on Jan 2016. There may be some technical rebound as oversold pressures build, but the technical rebound is likely to be met with formidable resistance at 22,280 – 22,510.
Near term supports: 21,373 – 21,388 / 21,220 / 21,055
Near term resistances: 21,895 / 21,958 / 22,280 – 22,510
Chart 2: Hang Seng is on a downtrend as oversold pressures build
Source: Chartnexus chart as of 23 Dec 2016
STI Index
On 9 Dec 2016, I wrote that “STI is on a clear uptrend with all its EMAs rising. The EMAs also formed golden cross formations. Amid positively placed DIs, ADX has risen from 23 on 25 Nov 2016 to 26 on 9 Dec 2016, indicative of a trend. However, in the near term, STI seems to have rallied too much and the likelihood of a retracement (i.e. profit taking or consolidation but likely not a trend reversal) is high. STI’s RSI closed at 72 on 9 Dec 2016. Since May 2015, there is usually profit taking when STI reaches 70 or more. Indicators such as MACD and OBV are exhibiting bearish divergences. Notwithstanding the possible retracement, if there is no sustained break below 2,860, the break above 2,911 points to an eventual measured technical target of 3,040.”
–> In line with expectations on possible profit taking, STI fell 85 points, or 2.9% to close at 2,871 on 23 Dec 2016.
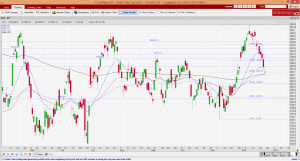
Based on Chart 3 below, STI has dropped 110 points from an intraday high of 2,981 on 8 Dec 2016 to close at 2,871 on 23 Dec 2016 (intraday low on 23 Dec was 2,866). The recent pullback is on lower than average volume. 20D and 50D EMA have turned down but 100D and 200D EMA are still rising. The DIs are negatively placed with ADX at 21 on 23 Dec 2016. RSI has dropped from 72 on 9 Dec 2016 to 41 on 23 Dec 2016. This is not oversold yet. STI is testing its critical supports around 2,864. A sustained break below the confluence of 100D and 200D EMA at 2,864 is bearish for the chart.
Near term supports: 2,864 / 2,844 / 2,810 – 2,812
Near term resistances: 2,882 / 2,896 / 2,902 – 2,905
Chart 3: A sustained break below 2,864 is bearish
Source: Chartnexus chart as of 23 Dec 2016
Conclusion
Notwithstanding my cautious outlook on the stock markets, with the help of CFDs, I have doubled my exposure by accumulating small mid cap stocks to 107% on 23 Dec 2016. This is because I believe that these stocks may outperform the general market in the next 1-3 months. (My clients have, will & are informed on new stocks which I have entered and any significant portfolio change.)
As I have previously mentioned before, everybody is different thus, the percentage invested should differ per your risk profile, return expectation, market outlook, investment horizon, commitments etc. Readers should be aware of the following events in the next few weeks:
Readers who wish to be notified of my write-ups and / or informative emails, can consider signing up at http://ernest15percent.com. However, this reader’s mailing list has a one or two-day lag time as I will (naturally) send information (more information, more emails with more details) to my clients first. For readers who wish to enquire on being my client, they can consider to leave their contacts here http://ernest15percent.com/index.php/about-me/
Lastly, many new clients have asked me how I screen and decide which companies to take a closer look / write. To understand more about my basis of deciding which companies to write, you can download a copy of my eBook available on my website HERE.
P.S: Do note that as I am a full time remisier, I can change my equity allocation fast to capitalize on the markets’ movements.
Hereby wishing all of you: Merry Xmas & Best wishes to you and your love ones in 2017 ahead!
Disclaimer
Please refer to the disclaimer HERE


hydroxychloroquine sulfate generic plaquenil arthritis