Dear readers,
Two weeks ago, I mentioned that although Hang Seng is in a downtrend, it may rebound as oversold pressures build. Hang Seng jumped 928 points in the past two weeks. What lies ahead?
S&P500 Index
Just to recap what I have mentioned on 23 Dec 2016 (see HERE), I wrote “S&P500 is consolidating its gains for the past two weeks. It continues to be on a clear uptrend amid rising exponential moving averages (“EMAs”). ADX continues to rise from 36 on 9 Dec 2016 to 39 on 23 Dec 2016 on the backdrop of positive placed directional indicators (“DIs”). My personal view is that S&P500 may trade within the range of 2,241 – 2,300 in the next one week. A sustained break below 2,241 with volume expansion has an eventual measured technical target of 2,212.”
–> For the past two weeks, there was only one day where S&P500 closed below 2,241. Since 23 Dec 2016, S&P500 closed 13 points higher, or 0.6% to 2,277 on 6 Jan 2017.
Based on Chart 1 below, S&P500 continues to on a clear uptrend amid rising EMAs. Although ADX has slid from 39 on 23 Dec 2016 to 29 on 6 Jan 2017, it is still indicative of a trend amid positive placed DIs. With the recent rally in S&P500 since the intraday low of 2,234 on 30 Dec 2016, RSI is not overbought yet and closed at 65.
Since 8 Dec 2016, S&P500 has been consolidating between 2,238 – 2,278 and it seems to be staging an upside breakout. A sustained break above 2,278 points to an eventual measured technical target 2,318. Conversely, a sustained break below 2,238 points to an eventual measured technical target 2,198. As the trend continues to be up (unless proven otherwise), the odds of an upside breakout outweigh that of a downside breakdown.
Near term supports: 2,260 / 2,252 / 2,242
Near term resistances: 2,300 / 2,318 / 2,325
Chart 1: S&P500 odds of an upside breakout > downside breakdown

Source: Chartnexus chart as of 6 Jan 2017
Hang Seng Index
On 23 Dec 2016, I mentioned that “Hang Seng chart is on a downtrend. All three EMAs (20D, 50D and 100D) are falling and 200D EMA is starting to decline. 20D EMA has formed a death cross with 200D EMA on 22 Dec 2016. 50D EMA and 100D seem to be forming a death cross too. Amid negatively placed DIs, ADX resumed its climb from 22 on 9 Dec 2016 to 28 on 23 Dec 2016. This is indicative of a trend. The break below 22,290 points to an eventual technical target of around 21,388.
A saving grace to this down trending Hang Seng is that RSI has dropped to an oversold level of 29 which is the lowest level last seen on Jan 2016. There may be some technical rebound as oversold pressures build, but the technical rebound is likely to be met with formidable resistance at 22,280 – 22,510.”
–> In line with the above expectations, Hang Seng touched an intraday low of 21,489 on 28 Dec 2016 (<0.5% away from my eventual measured technical target of 21,388) before it rebounded 1,117 points, or 5.2% higher. Hang Seng closed at 22,503 which was in line with my aforementioned resistance 22,280 – 22,510.
Based on Chart 2 below, with the recent rebound, there is an improvement in Hang Seng chart. All the EMAs have stopped their declines with 21D EMA inching upwards. Hang Seng has closed above its 200D EMA for the past two trading days. Amid positively placed DIs, ADX has slid from 28 on 23 Dec 2016 to 22 on 6 Jan 2017. This is still indicative of a trend, albeit weaker. With the sharp rebound, RSI has risen from 29 on 23 Dec 2016 to close at 57 on 6 Jan 2017. This is not overbought yet.
Personally, I will take the next couple of weeks to observe whether Hang Seng can maintain its close above its 200D EMA. All in, there is an improvement in Hang Seng’s chart in the past two weeks.
Near term supports: 22,417 – 22,455 / 22,190 – 22,280 / 22,000
Near term resistances: 22,675 / 22,850 / 23,055
Chart 2: Hang Seng chart improved since two weeks ago
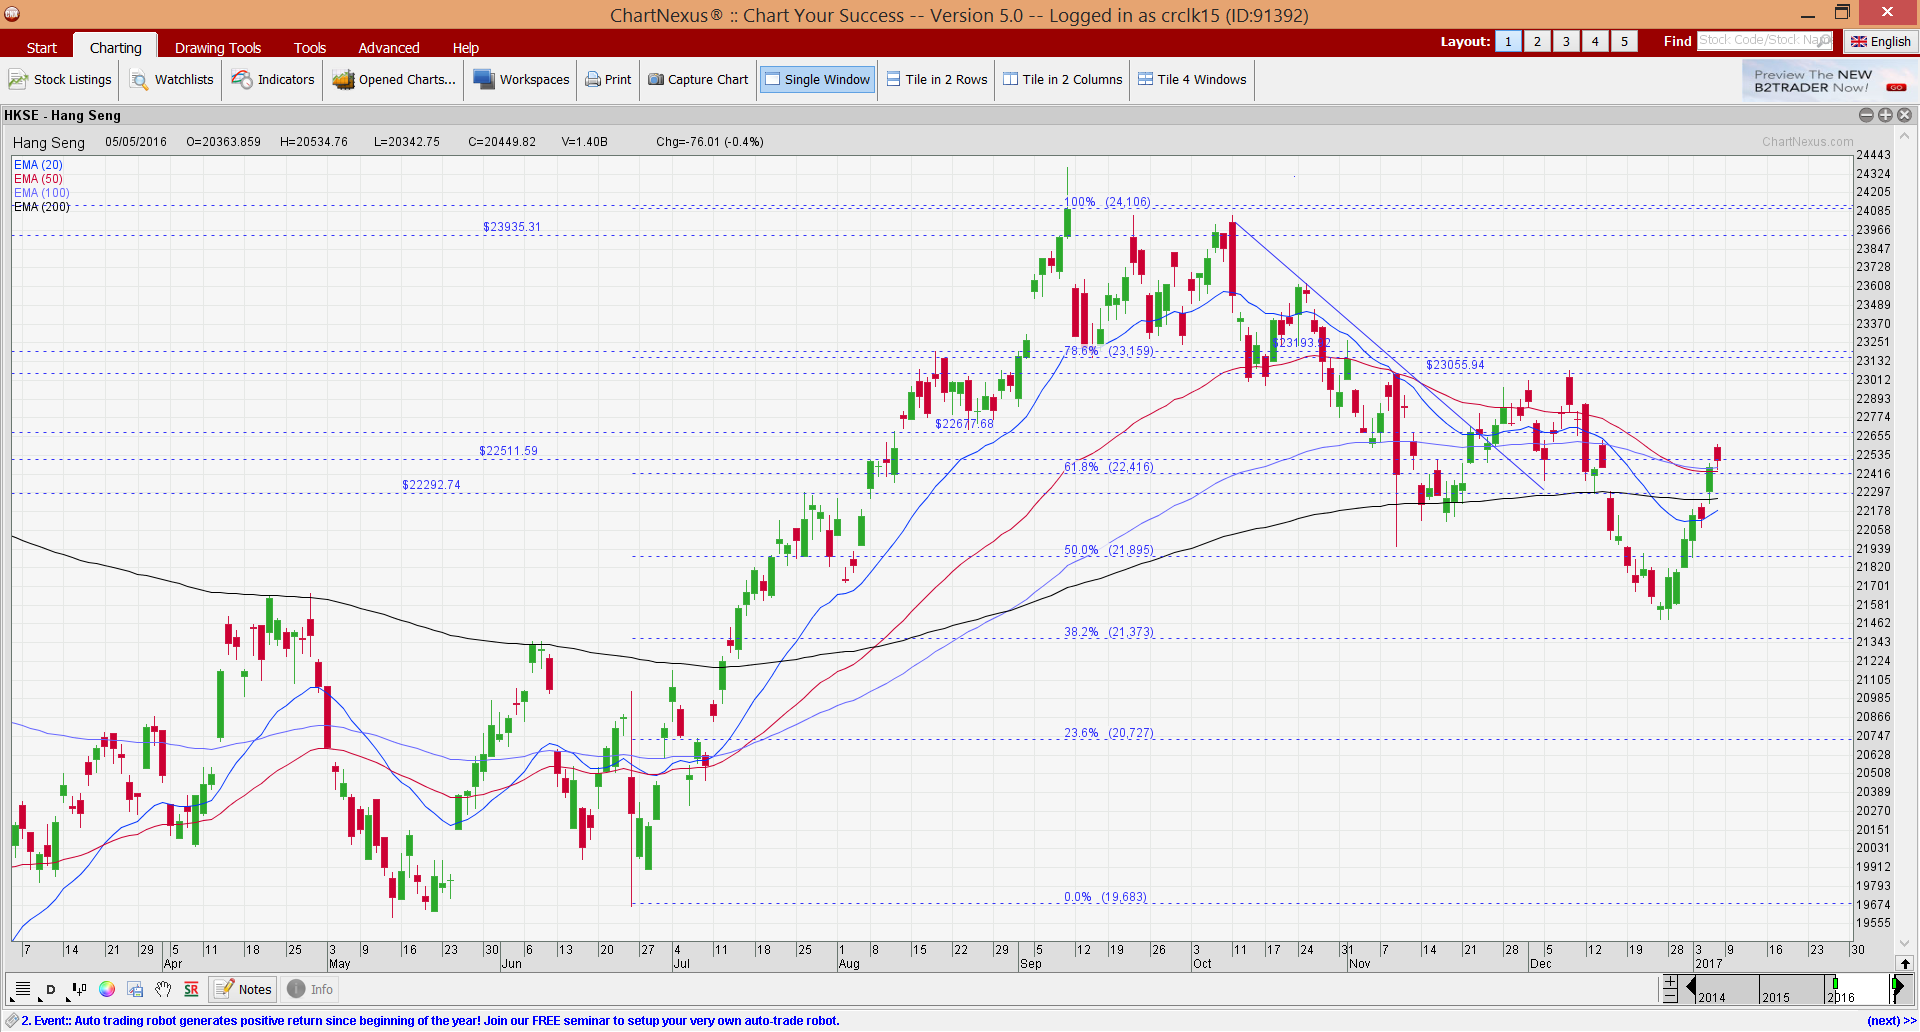
Source: Chartnexus chart as of 6 Jan 2017
STI Index
On 23 Dec 2016, I wrote that “The recent pullback is on lower than average volume. 20D and 50D EMA have turned down but 100D and 200D EMA are still rising. The DIs are negatively placed with ADX at 21 on 23 Dec 2016. RSI has dropped from 72 on 9 Dec 2016 to 41 on 23 Dec 2016. This is not oversold yet. STI is testing its critical supports around 2,864. A sustained break below the confluence of 100D and 200D EMA at 2,864 is bearish for the chart.”
–> For the past two weeks, STI touched an intraday low of 2,858 on 27 Dec 2016 but it closed immediately higher 2,886 on the same day. In other words, the critical support around 2,864 was not breached. STI eventually closed 3.2% higher from 2,871 on 23 Dec 2016 to 2,963 on 6 Jan 2017.
Based on Chart 3 below, it is positive that STI did not make any sustained close below its critical support of around 2,864. I have highlighted this critical level of 2,860 – 2,864 since 9 Dec 2016. The critical support level changes slightly from 2,860 (9 Dec) to 2,864 (23 Dec) due to the movements in the EMAs. The DIs are positively placed and ADX has halted its decline and inched upwards to close at 19. RSI closed at 66 on 6 Jan 2017 which is not an overbought level.
As there is no sustained break below 2,864, I reiterate my view (similar to that on 9 Dec) that the break above 2,911 points to an eventual measured technical target of 3,040. A sustained break below the confluence of 100D and 200D EMA at 2,864 is bearish for the chart.
Near term supports: 2,955 / 2,941 / 2,933
Near term resistances: 2,980 / 3,000 / 3,025 – 3,032
Chart 3: A successful test on 2,864 is bullish for STI
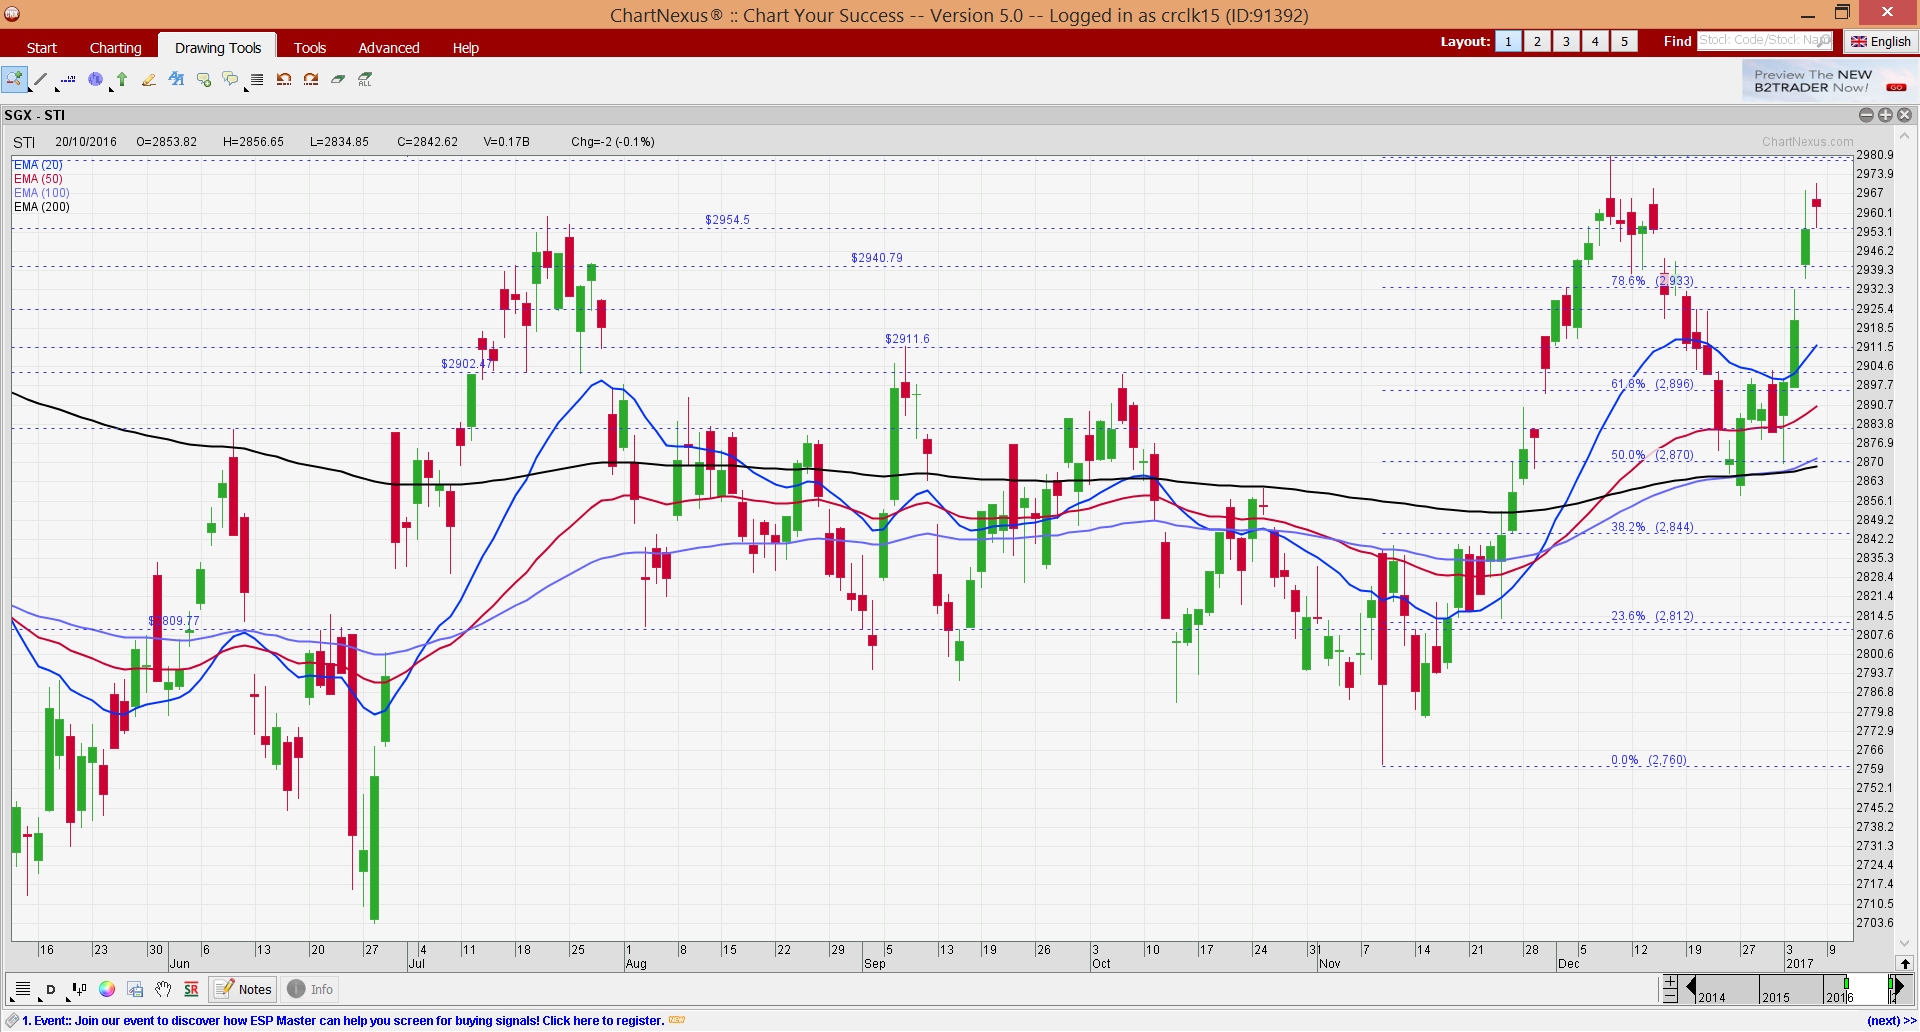
Source: Chartnexus chart as of 6 Jan 2017
Conclusion
With reference to my 23 Dec 2016 write-up, I mentioned that I have doubled my exposure by accumulating small mid cap stocks to 107%. This is because I believe they may outperform the general market in 1-3 months. My intention since Dec was to accumulate selective small mid cap stocks with potential catalysts and to sell them on rallies. With the recent market rally, I have taken profit and reduced my percentage allocation in equities to 76%. I am likely to take the recent rebound to sell into strength and aim to reduce my overall percentage invested to <50%. (My clients have, will & are informed on new stocks which I have entered and any significant portfolio change.)
Personally, I have mentioned to my clients that 2017 is likely to be a volatile year, if not more volatile than 2016. This is evident as there is a list of multiple important events in 2017 (See Figure 1 below) which is likely to induce market gyrations.
Figure 1: List of important events in 2017
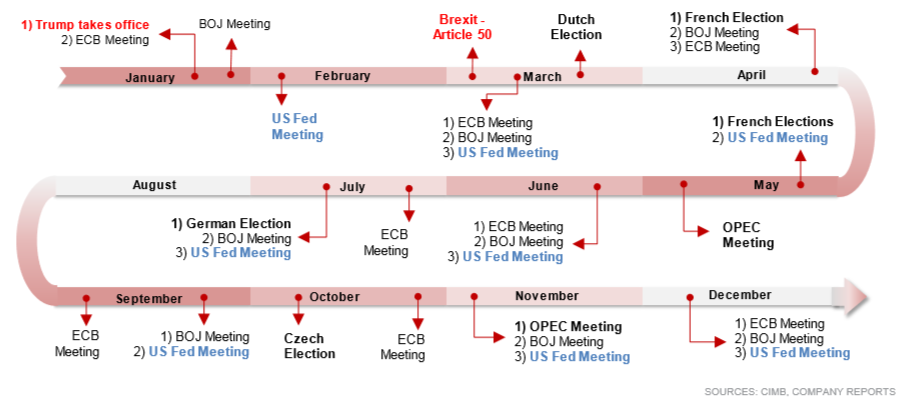
Based on CIMB’s research, STI is trading at its historical mean of around 14x FY17F PE. This does not seem to be extremely cheap. Thus, in order to get outperformance, or outsized gains, it is more imperative than ever to pick the right stocks. i.e. alpha is more important than beta.
As I have previously mentioned before, everybody is different thus, the percentage invested should differ per your risk profile, return expectation, market outlook, investment horizon, commitments etc.
Readers who wish to be notified of my write-ups and / or informative emails, can consider signing up at http://ernest15percent.com. However, this reader’s mailing list has a one or two-day lag time as I will (naturally) send information (more information, more emails with more details) to my clients first. For readers who wish to enquire on being my client, they can consider to leave their contacts here http://ernest15percent.com/index.php/about-me/
Lastly, many new clients have asked me how I screen and decide which companies to take a closer look / write. To understand more about my basis of deciding which companies to write, you can download a copy of my eBook available on my website HERE.
P.S: Do note that as I am a full time remisier, I can change my equity allocation fast to capitalize on the markets’ movements.
Disclaimer
Please refer to the disclaimer HERE