Dear all,
Happy Chinese New Year! How is your Rooster Year so far?
S&P500 and STI reached near, or at my near-term resistances. What’s next?
S&P500
Just to recap what I have mentioned on 13 Jan 2017 (see HERE), I wrote “It is clear that S&P500 continues to on an uptrend amid rising EMAs. S&P500 closed at 2,275 on 13 Jan 2017. Since 8 Dec 2016, S&P500 has been consolidating between 2,238 – 2,278 and it seems to be staging an upside breakout. A sustained break above 2,278 / below 2,238 points to an eventual measured technical target 2,318 / 2,198 respectively. One area of concern is the bearish divergences shown in the indicators, such as RSI, MACD and MFI etc. Although these signals are not outright sell signals, I am cautious especially given the limited potential upside say 2,325 vs 2,275, i.e. 40 points only.”
–> S&P500 broke up on the upside and closed at 2,295 on 27 Jan 2017.
Based on Chart 1 below, it is very worrying (more worrying than 13 Jan) that the various indicators such as RSI, MACD, OBV and MFI continue to exhibit bearish divergences. ADX has slid from 41 in Dec 2016 to close at around 20 on 27 Jan 2017, which may indicate that the trend seems to be weakening. Given the various chart indications, although S&P500 continues to be on an uptrend amid rising exponential moving averages (“EMAs”), I reiterate that S&P500 may have limited potential upside with resistance 2,300 – 2,325. It is unlikely to make a sustained close above 2,325 in the near term.
Near term supports: 2,285 / 2,273 – 2,278 / 2,260
Near term resistances: 2,300 / 2,318 / 2,325
Chart 1: S&P500 – limited potential upside around 2,300 – 2,325

Source: Chartnexus chart as of 27 Jan 2017
Hang Seng Index
Based on my write-up on 6 Jan 2017 (click HERE for previous write-up on Hang Seng’s chart), I mentioned that “All the EMAs have stopped their declines with 21D EMA inching upwards. Hang Seng has closed above its 200D EMA for the past two trading days. Amid positively placed DIs, ADX has slid from 28 on 23 Dec 2016 to 22 on 6 Jan 2017. This is still indicative of a trend, albeit weaker. With the sharp rebound, RSI has risen from 29 on 23 Dec 2016 to close at 57 on 6 Jan 2017. This is not overbought yet. Personally, I will take the next couple of weeks to observe whether Hang Seng can maintain its close above its 200D EMA. All in, there is an improvement in Hang Seng’s chart in the past two weeks.”
–> As previously mentioned, Hang Seng’s chart has improved. Hang Seng surged 871 points, or 3.9% from 22,503 on 6 Jan 2017 to close 23,374 on 27 Jan 2017.
Based on Chart 2 below, Hang Seng’s chart looks more promising than S&P500. The EMAs are rising with 20D EMA forming golden crosses with 50D, 100D and 200D EMA. Amid positively placed directional indicators (“DI”), ADX has risen from 22 on 6 Jan 2017 to close at 24 on 27 Jan 2017, indicative of a trend. Most of the indicators such as RSI, OBV and MACD have not exhibited bearish divergences.
With the sharp rebound, RSI has risen from 57 on 6 Jan 2017 to close at 70 on 27 Jan 2017. Except for one period around Sep 2016 where RSI hit 80, it does not usually exceed the low 70s since May 2015.
Near term supports: 23,056 – 23,066 / 22,787 – 22,845 / 22,655 – 22,678
Near term resistances: 23,560 / 23,930 / 24,100
Chart 2: Hang Seng looks more promising than S&P500 but is getting overbought
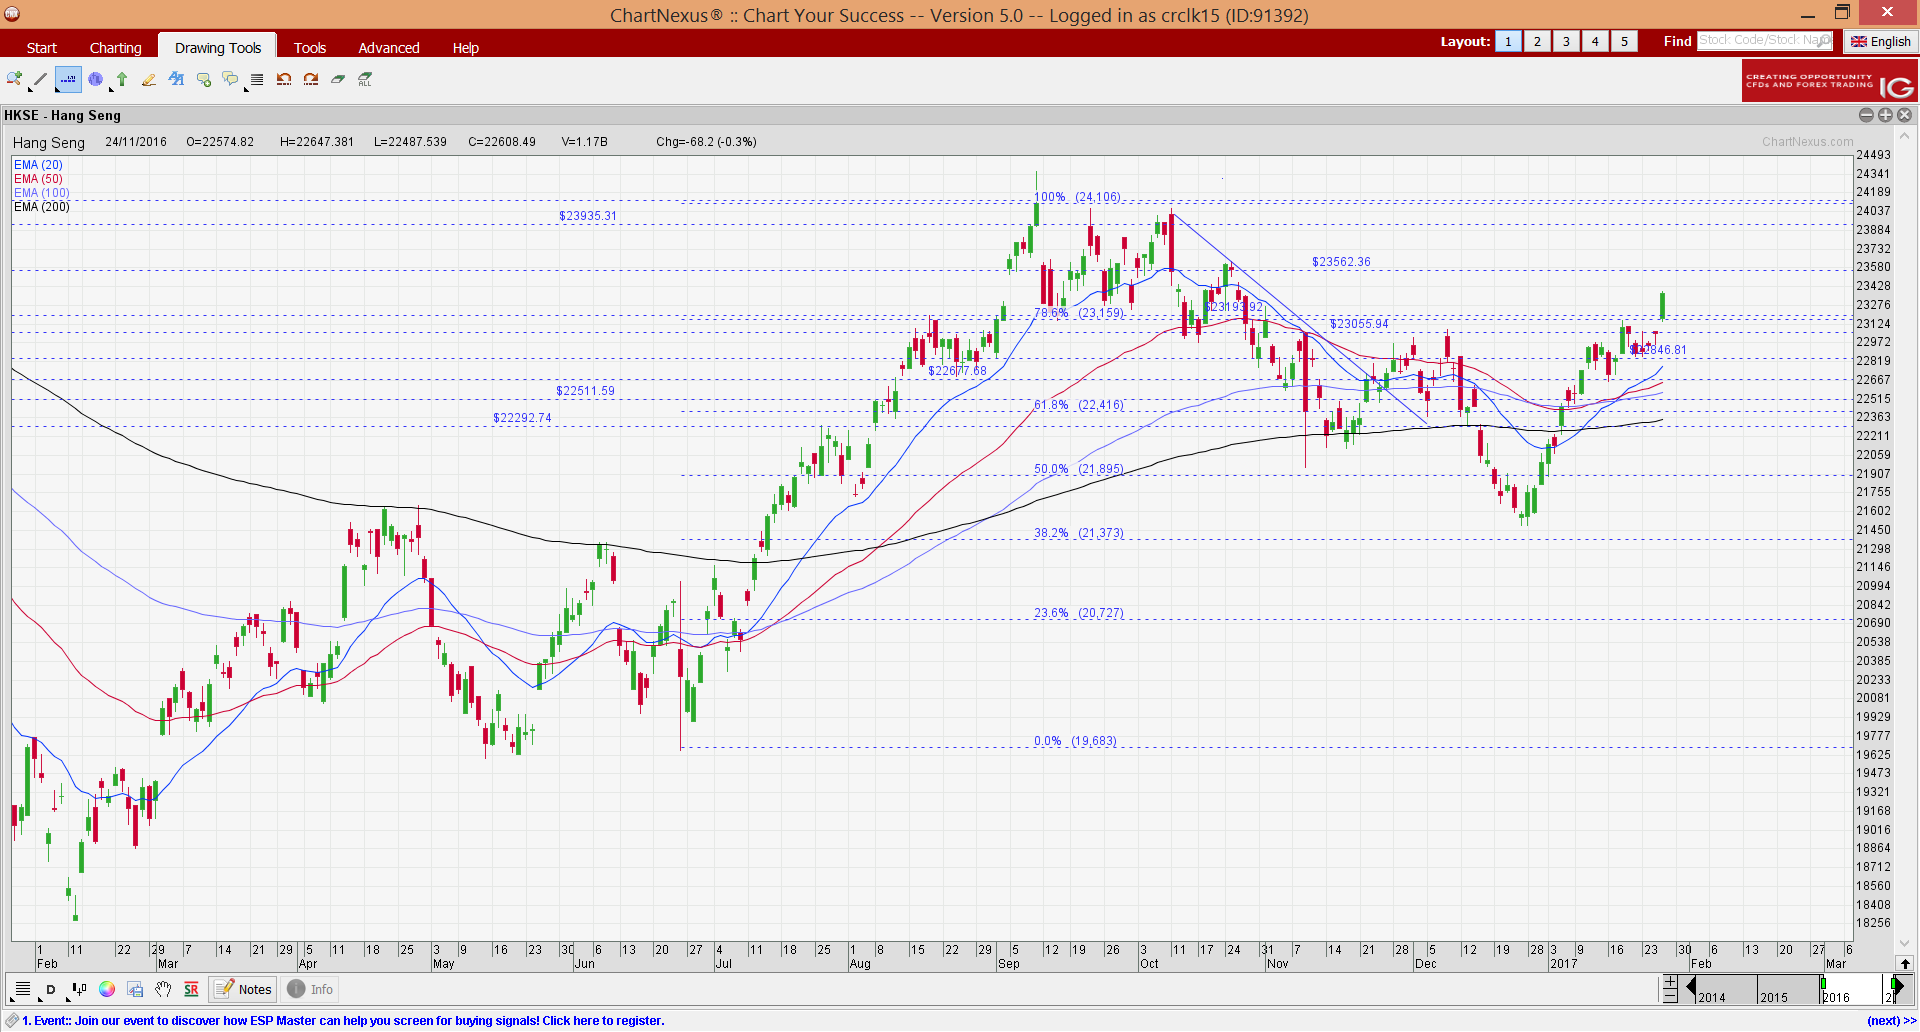
Source: Chartnexus chart as of 27 Jan 2017
STI
On 13 Jan 2017, I wrote “Based on Chart 3 below, my eventual measured technical target remains at 3,040 (similar to what I mentioned on 9 Dec). STI may overshoot but I doubt it can make a sustained close above 3,064 in the near term. Thus, this leaves about (3,064 – 3,025) = 39 points potential near term upside. It is noteworthy that RSI closed at 73 on 13 Jan 2017 which is approximately the highest close since Apr 2015. RSI closed at around 80 on 15 Apr 2015 where STI peaked around 3,540. Furthermore, indicators such as OBV, MACD and MFI are exhibiting bearish divergences. As indicated above, bearish divergences are not outright sell signals but they indicate “caution” to me.”
–> STI closed at my aforementioned resistance of around 3,065, the highest close since 27 Oct 2015.
Based on Chart 3 below, I am very cautious on STI’s chart on several fronts
a) STI has reached my near term eventual measured technical target of 3,040 and my view remains the same. i.e. It is unlikely to make a sustained close above 3,064;
b) It formed a dragonfly doji on 27 Jan 2017. This signifies indecision and may portend a reversal, especially when it forms after an established uptrend, coupled with resistance levels;
c) Indicators such as OBV and MFI have continued to exhibit bearish divergences. As indicated above, bearish divergences are not outright sell signals but they indicate “caution” to me.”
d) RSI closed in the overbought region at 75 on 27 Jan 2017. This is approximately the highest close since Apr 2015.
All in, my personal view is that STI’s chart seems to have limited potential upside. Coupled with the above points, STI’s risk – reward is not favourable for long positions. Furthermore, my view is that it is likely to be most prone to profit taking vis-à-vis S&P500 and Hang Seng.
Near term supports: 3,044 -3,048 / 3,025 – 3,032 / 2,999 – 3,002
Near term resistances: 3,088 – 3,090 / 3,116 / 3,148
Chart 3: STI – I am cautious due to the above points
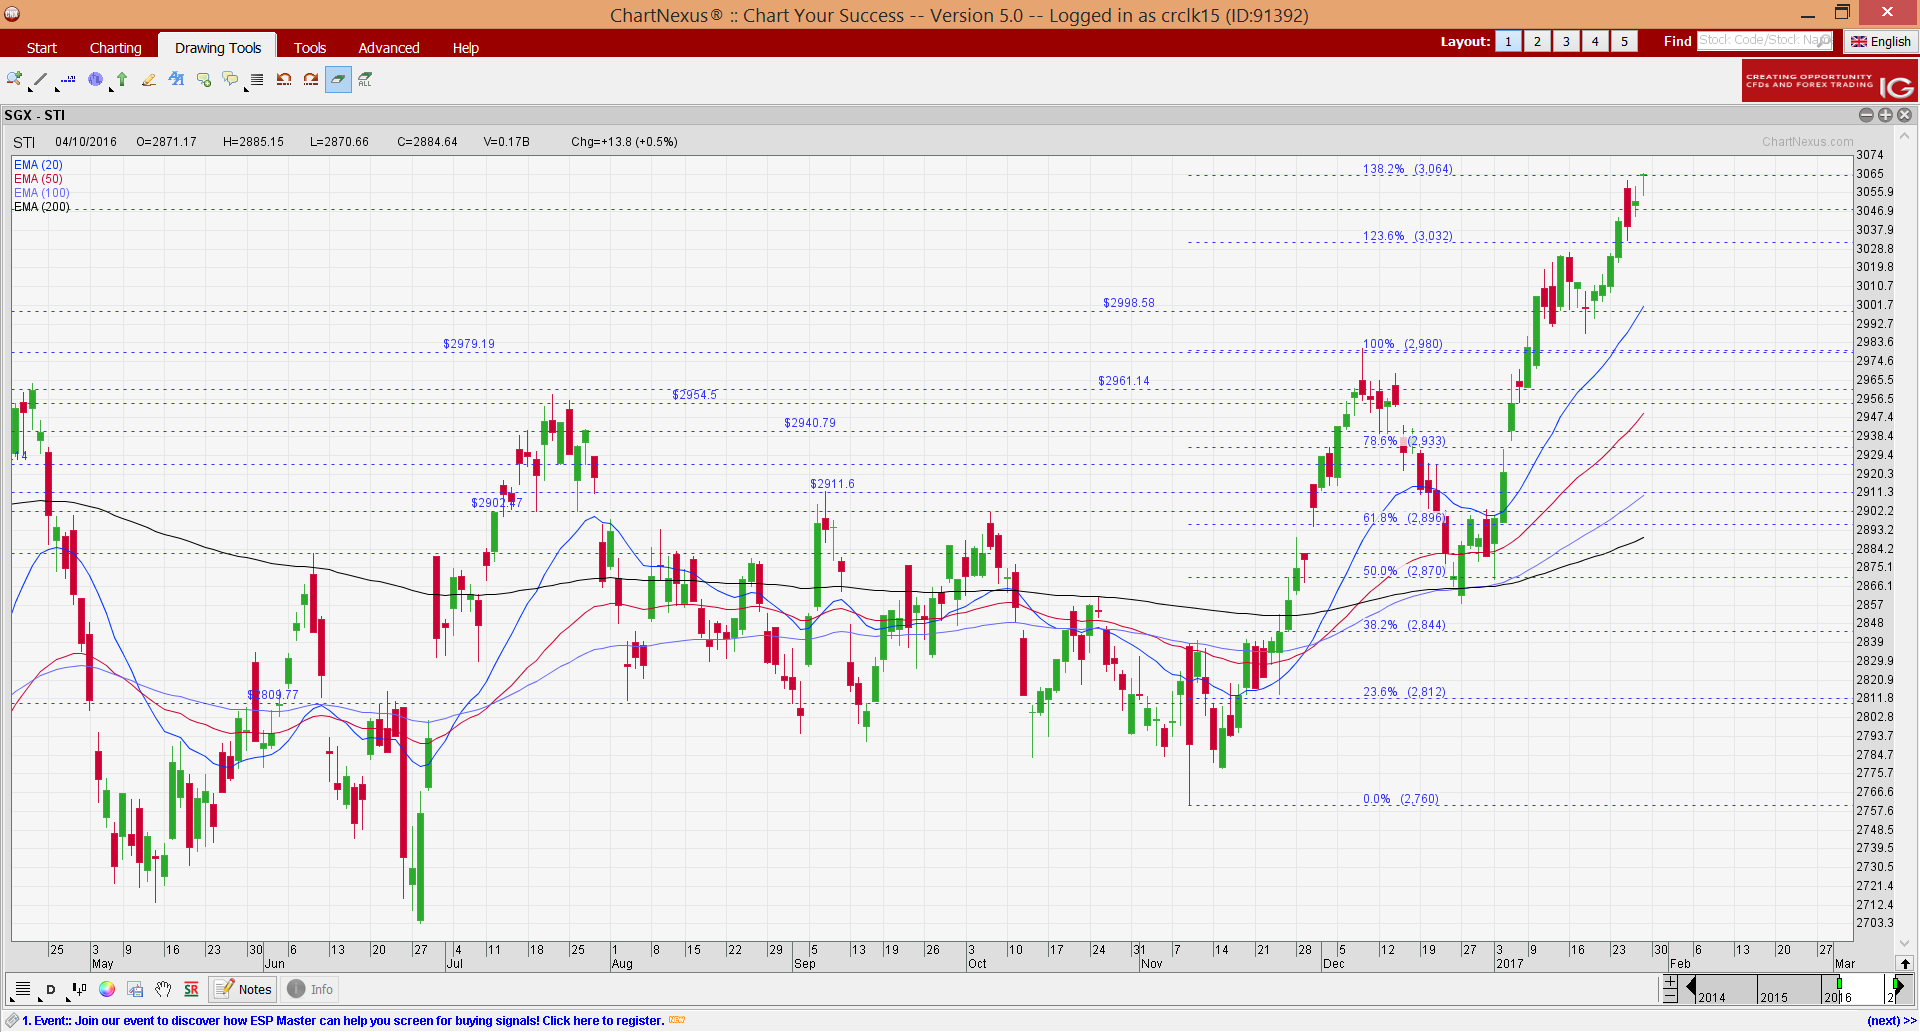
Source: Chartnexus chart as of 27 Jan 2017
Conclusion – cautious on general market but ready to buy selective stocks on weakness
Since 13 Jan 2017, I have taken profit on some stocks and have initiated short positions on overbought stocks. Thus, my net percentage invested was reduced from approximately 79% invested to less than 50% invested.
I am ready to pare my percentage invested if markets, or the specific stocks which I hold continue to rise. On the other hand, as I am already less than 50% invested, I am also ready to buy into (other) selective stocks on weakness. (My clients have, will & are informed on new stocks which I have entered and upon any significant portfolio change.)
Based on data sourced from Bloomberg as of 27 Jan 2017, I have compiled a list of stocks whose RSI >=70. The top five most overbought stocks are Sunpower, Dairy Farm, Talkmed, Bukit Sembawang and Best World. (See Table 1 below). Readers who are on my website signup list will receive the full list of overbought stocks by email.
Table 1: Top five stocks sorted by highest RSI
![]()
Source: Bloomberg as of 27 Jan 2017 (Note that the above RSI may close at different levels as I sourced the above data from Bloomberg in the morning before market close). For example, Dairy Farm’s RSI closed at 87 on 27 Jan 2017.
Among the five stocks, Dairy Farm is at all time overbought since 1990. At such overbought level, it is reasonable to expect that any near-term gains may be difficult to come by. Please see my separate write-up on Dairy Farm. (Click HERE)
Hereby, wishing all readers a blessed and prosperous Rooster Year ahead!
Readers who wish to be notified of my write-ups and / or informative emails, can consider signing up at http://ernest15percent.com. However, this reader’s mailing list has a one or two-day lag time as I will (naturally) send information (more information, more emails with more details) to my clients first. For readers who wish to enquire on being my client, they can consider to leave their contacts here http://ernest15percent.com/index.php/about-me/
Lastly, many new clients have asked me how I screen and decide which companies to take a closer look / write. To understand more about my basis of deciding which companies to write, you can download a copy of my eBook available on my website HERE.
P.S: Do note that as I am a full time remisier, I can change my equity allocation fast to capitalize on the markets’ movements.
Disclaimer
Please refer to the disclaimer HERE
Appealing read and also the subject matter was good. Thank you with regard to creating this article! I will certainly be actually back for additional!