Sapphire’s share price slumped 8% from $0.335 on 27 Feb 2017 (before their results on 27 Feb, after market) to close $0.310 on 10 Mar 2017. Are their FY16 results bad? If yes, why does Mr Teh, CEO of Sapphire, record his first purchase since Sep 2015 now?
Below are my five observations on Sapphire’s results. Click HERE for the press release.
Table 1: Snapshot of Sapphire’s results
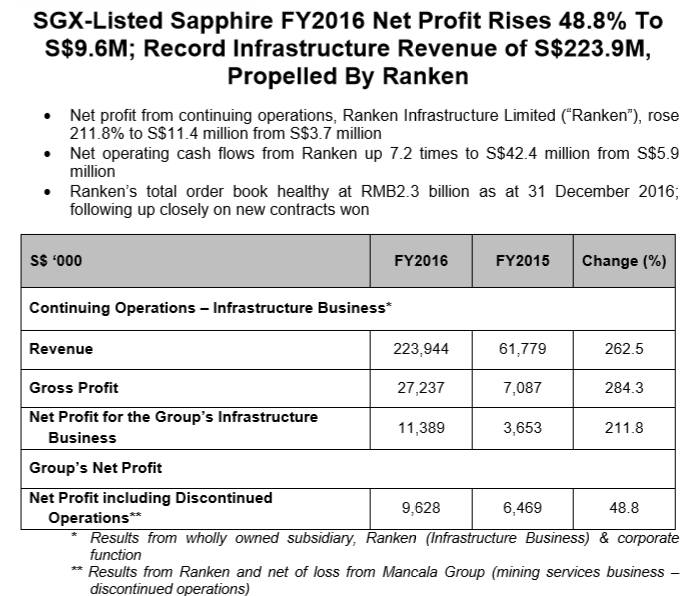
Source: Company
5 observations on Sapphire’s results
1.Disposed loss making Mancala to be a focused infrastructure play
Sapphire has divested the bulk of Mancala. Based on most industry experts, it is likely that the mining industry may have bottomed in 2016. Thus with the 81% disposal of Mancala, it is likely that Sapphire may not report any significant losses in FY17F. With this disposal, Sapphire has become a serious and focused infrastructure play which may aid in their resource management and possible future re-rating prospects.
2.FY17F likely to be better
Based on the above assumption that Mancala may not report significant losses in FY17F, Sapphire is likely to generate net profit of around S$11.4m in FY17F, based on 0% growth in earnings for FY17F (See Table 1 above where Sapphire’s infrastructure business generated $11.4m profit in FY16). Given such conservative estimates, Sapphire trades at 9x FY17F earnings. However, management continues to target a 20-30% growth in capacity in FY17F which may translate to approx. 20-30% growth in revenue next year in a simplistic way. Such growth is likely to translate to around 6 – 8 x FY17F PE ceteris paribus. Midas trades at 17x FY17F PE. (I wish to emphasise that I am NOT an analyst and any estimates, especially on valuations and earnings estimates, are purely my guesstimates only.)
3.Balance sheet strengthens
Besides improvement in net profit and net operating cash flow, Sapphire’s gearing has improved from 0.79x to 0.40x in FY16. Net asset value also increased from $0.27 on 31 Dec 2015 to $0.30 on 31 Dec 2016.
4.May have contracts soon
I noted a peculiar sentence in both Sapphire’s press release and its detailed financial results. I assume management is aware that up to now, they have not announced any contracts since 28 Sep 2016 thus, they seek to assure investors. For example, under para 10 in detailed financial results, management wrote “The Group’s order book stood at RMB2.3 billion ($478.9 million) as at 31 December 2016 after delivering part of the works in progress while following up closely on new contracts won over the next few weeks.” What I interpret from this sentence (purely my guess à may, or may not be the true picture), is that management is following up closely on the status of its new contract bids.
5.Industry prospects continue to be bright
Based on its FY16 results, management is confident that Ranken is well positioned to ride the wave of public infrastructure spending / construction management works in China, Bangladesh and other parts of South Asia. According to some statistics, China is expected to invest a further RMB 4.7 trillion in transport infrastructure over the next three years as it extends its ‘One Belt, One Road’ initiative.
CEO’s purchase, first since Sep 2015
There is another noteworthy development on Sapphire after its FY16 results. Mr Teh, CEO of Sapphire bought 300K Sapphire shares @$0.323 on 28 Feb 2017 & 415K shares @$0.318 on 1 Mar 2017. This was the first purchase since his purchase of 550K Sapphire shares @$0.240 on 10 Sep 2015 (adjusted for post share consolidation). On 8 Mar 2017, Mr Teh acquired another 2m Sapphire shares @$0.315 via off market purchase. Furthermore, on 9 Mar 2017, Mr Teh further bought 173K Sapphire shares @$0.315. This raised his stake to 7.02m Sapphire shares.
Based on my personal observations (which arguably are not corroborated by hard facts), recall that Mr Sydney Yeung, GSS Energy CEO started his first (after a few years) purchases of GSS Energy shares at $0.085 in Jan 2017 [click HERE for my late Nov 2016 write-up when GSS Energy last traded at $0.078]. GSS Energy subsequently rocketed to an intraday high of $0.190 on 7 Mar 2017 without any significant announcements, except for their FY16 results announcement and subsequent share purchases by Sydney. Sydney is positive on his company’s prospects where he started buying his company’s shares in Jan 2017 while the market does not believe the company’s prospects. GSS Energy closed at $0.173 on 10 Mar 2017.
Why do I cite GSS Energy here? This is because based on my personal observations, there seems to be parallels between this share purchase in GSS Energy and Sapphire’s share purchase. Although I am aware that there is no 100% link between the first (after a few years) insider share purchases vs whether the share price will move higher in the months ahead, those who know Mr Teh personally are aware that he has a good track record, be it in managing companies or investments.
Let’s wait, see and assess.
Possible M&A?
Based on a 16 Jan 2017 The Edge article, it was reported that Sapphire is on a look-out for possible synergistic M&A to boost their product offerings. For example, it may acquire companies with product offerings in crowd monitoring and management systems that would be needed in places such as railway stations. These acquisitions are unlikely to be big acquisitions but it would be complementary to Sapphire.
Chart observations
Based on Chart 1 below, although 21D exponential moving average (‘EMA”) has turned lower, Sapphire is still on a medium-term uptrend. Indicators such as OBV, RSI, MACD have weakened. However, 100D and 200D EMA are still rising. A break below $0.295 with volume expansion and on a sustained basis is bearish for the chart. However, this seems unlikely with the cluster of supports around $0.295 – 0.315. Conversely, a break above $0.370 with volume expansion and on a sustained basis is bullish for the chart.
Near term supports: $0.310 – 0.315 / 0.305 / 0.300
Near term resistances: $0.320 / 0.335 / 0.345
Chart 1: Sapphire still on an uptrend since Jun 2016
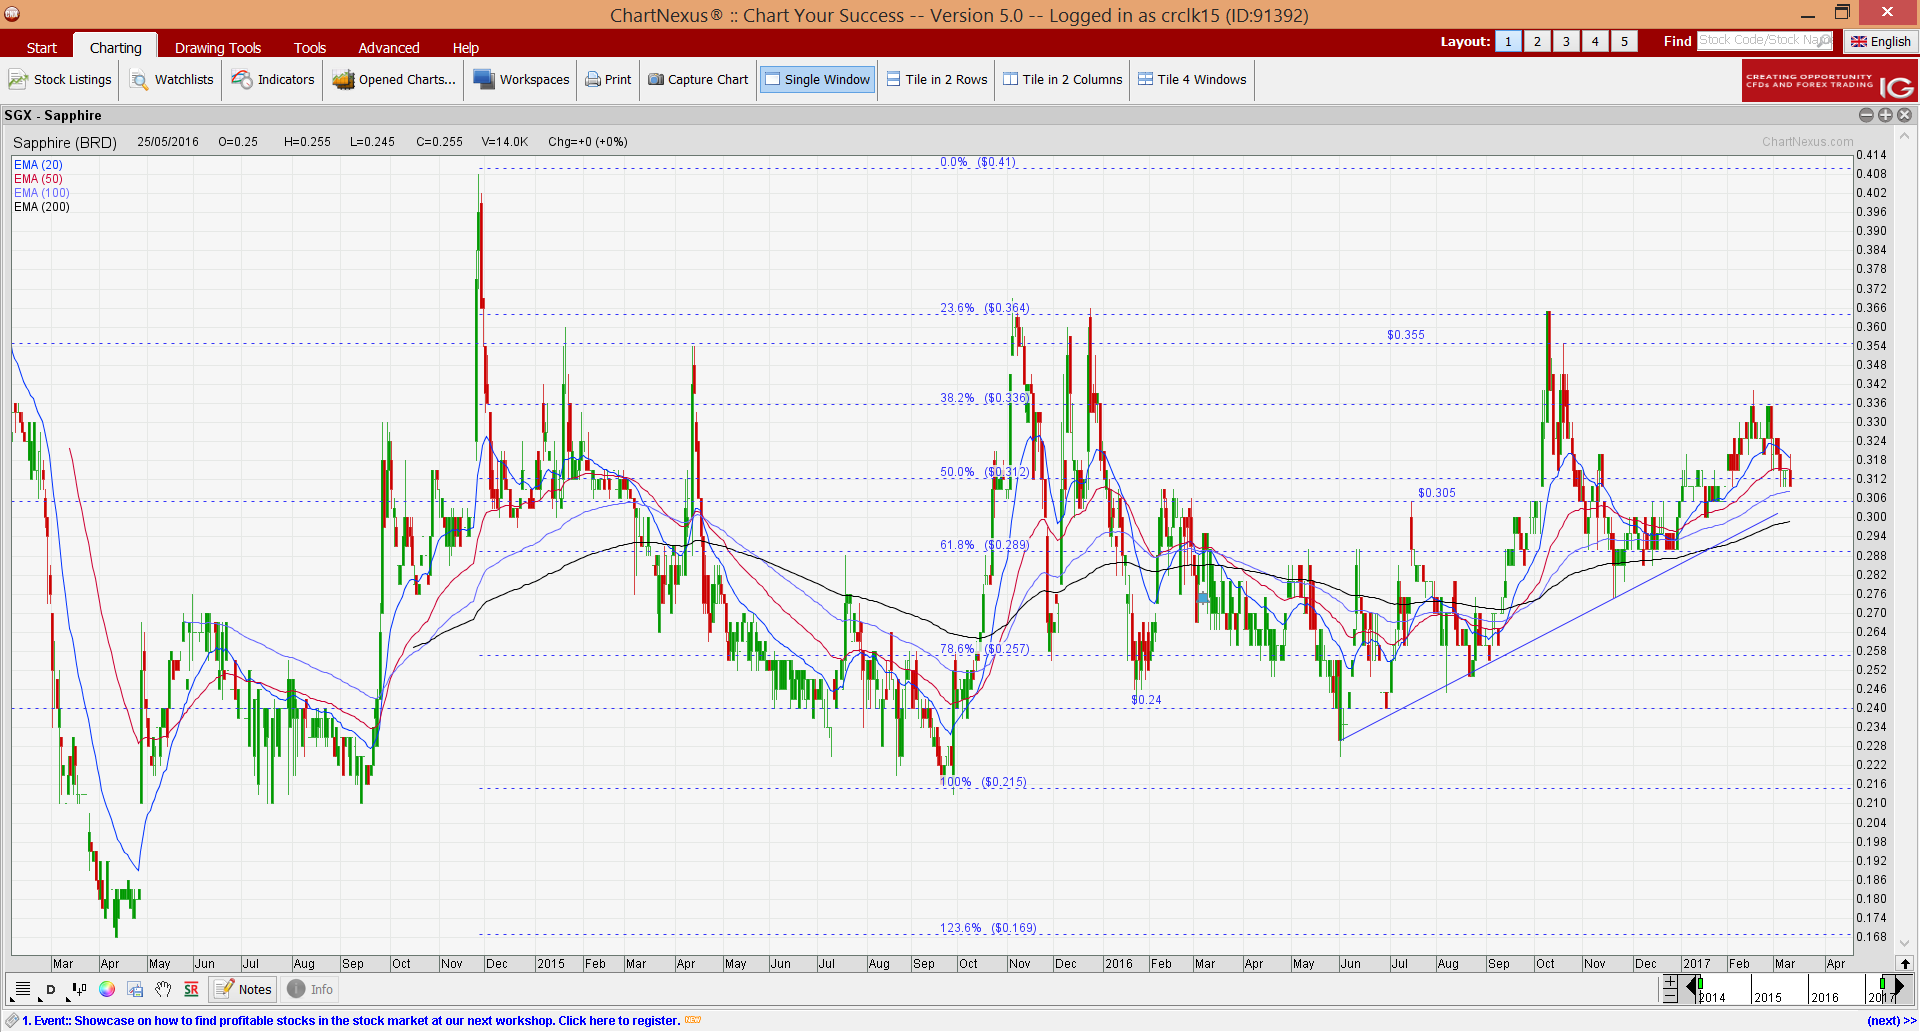
Source: Chartnexus 10 Mar 2017
Conclusion / Personal opinion
Although the market may view Sapphire’s results a tad below expectations on Mancala’s losses and lack of new contracts announced, my personal view is that Sapphire’s FY16 results look good based on the above observations. Furthermore, based on chart, Sapphire is trading near a cluster of strong supports around $0.295 – 0.315. This, coupled with insider’s purchase, bodes well for Sapphire. As with all investments (most investments carry a certain degree of risk), readers should carefully evaluate each investment decision with care.
Disclaimer
Please refer to the disclaimer HERE