Dear all,
S&P500 has dropped 28 points, or 1.2% from its intraday high of 2,401 on 1 Mar 2017. Is a correction coming?
S&P500
Just to recap what I have mentioned on 24 Feb 2017 (see HERE), I wrote “S&P500 continues to be entrenched in an uptrend, as evidenced by its rising exponential moving averages (“EMAs”). ADX started to rise from 18 on 10 Feb 2017 to 34 on 24 Feb 2017, indicative of a trend. RSI closed at 80 on 24 Feb 2017. It is noteworthy that RSI only crosses above 80 on a couple of trading sessions in the past three years. Furthermore, based on RSI and MACD, S&P500 is overbought. Although S&P500 has crossed above 2,325 (which I previously mentioned it is unlikely to make a sustained close above), I am very cautious on S&P500 in the near term as the odds of a profit taking increase vis-à-vis two weeks ago”
–> S&P500 closed marginally higher from 2,367 on 24 Feb 2017 to 2,373 on 10 Mar 2017.
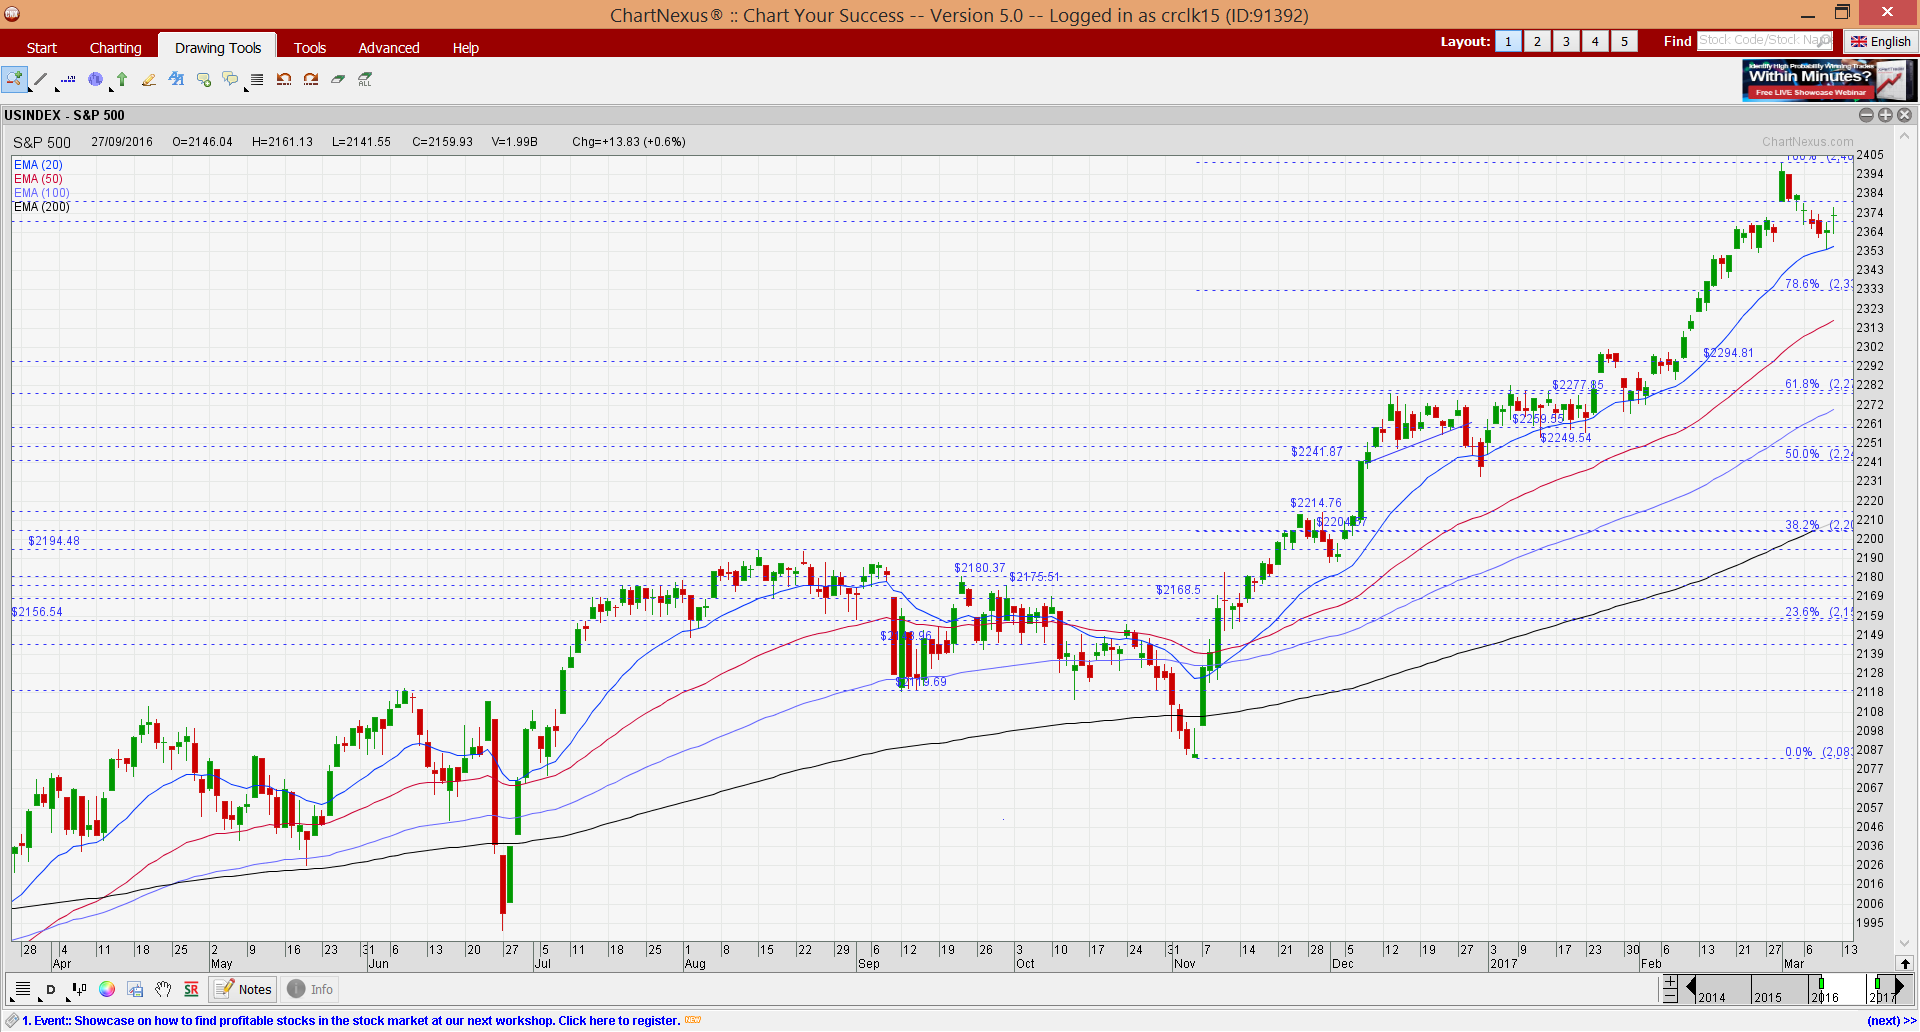
Based on Chart 1 below, all the EMAs are rising steadily. Since 8 Nov 2016, S&P500 has not traded below its 20D EMA for more than one trading session. Amid positively placed directional indicators (“DIs”), ADX has risen from 34 on 24 Feb 2017 to 38 on 10 Mar 2017, indicative of a trend. RSI has weakened from an overbought region of 80 on 24 Feb 2017 to 65 on 10 Mar 2017. OBV is still at an elevated area. From the chart, S&P500 continues to be entrenched in an uptrend. A sustained break below its rising 20D EMA (currently around 2,357) will be a tad bearish for the chart.
Near term supports: 2,355 -2,357 / 2,333 / 2,315
Near term resistances: 2,370 / 2,380 / 2,400
Chart 1: S&P500 continues to be on an uptrend
Source: Chartnexus chart as of 10 Mar 2017
Hang Seng Index
Based on my write-up on 24 Feb 2017, I mentioned that “Hang Seng’s chart continues to be on an uptrend as evidenced by its rising EMAs. Amid positive placed DIs, ADX has risen from 28 on 10 Feb 2017 to 37 on 24 Feb 2017, indicative of a trend. Indicators such as RSI, OBV have started to exhibit bearish divergences.”
–> Hang Seng dropped 397 points, or 1.7% from 23,966 on 24 Feb 2017 to close 23,569 on 10 Mar 2017. (near my previously mentioned resistance of around 23,930).
Based on Chart 2 below, 50D, 100D and 200D EMAs are still rising but 20D EMA seems to be turning around. Amid positive placed DIs, ADX has declined from 37 on 24 Feb 2017 to 27 on 10 Mar 2017. Although this is still indicative of a trend, the strength of the trend is weaker than before. RSI has weakened from 62 on 24 Feb 2017 to close 51 on 10 Mar 2017. In short, Hang Seng remains on an uptrend in the medium term but it may be a bit choppy in the near term.
Near term supports: 23,380 / 23,060 -23,180 / 22,850
Near term resistances: 23,680 – 23,730 / 23,950 / 24,100 -24,216
Chart 2: Hang Seng may turn choppy in the near term

Source: Chartnexus chart as of 10 Mar 2017
STI
Amid the various factors which I pointed out in my 24 Feb 2017 write-up, “there seems to be some cautionary signs that the risk to reward ratio is not favourable for long positions, except for the nimble. Firstly, indicators such as MACD, MFI, RSI continue to exhibit bearish divergences. Secondly, most STI component stocks have already released their results, thus there may arguably be less catalysts to hold on to these stocks as the dividends may only be ex in the next two to three months. Thirdly, with the STI being up 236 points year to date making it one of the best performing stock markets, there seems to be some inflows to selective small mid cap laggard stocks.”
–> STI hit my aforementioned resistance level 3,161 before profit taking set in. It rose 16 points or 0.5% from 3,117 on 24 Feb 2017 to close 3,133 on 10 Mar 2017.
Based on Chart 3 below, STI’s chart continues to be on an uptrend, evidenced by the rising EMAs. Similar to S&P500, STI has not traded below its 20D EMA since 4 Jan 2017. However, indicators such as MACD, MFI, OBV and RSI are exhibiting bearish divergences. A sustained break below the rising 20D EMA (currently at 3,110) will be a tad bearish for the chart. Conversely, a sustained break above 3,161 is bullish for the chart.
As previously mentioned, bearish divergences are not immediate sell signals. Furthermore, they can persist for some time and should be used in conjunction with other indicators.
Near term supports: 3,108 – 3,110 / 3,100 / 3,065
Near term resistances: 3,161 / 3,215 / 3,250
Chart 3: STI has traded above its 20D EMA since 4 Jan 2017

Source: Chartnexus chart as of 10 Mar 2017
Conclusion – “stock rotation” still in play
As per my write-up on 10 Feb 2017, I mentioned that the recent market trend is “stock rotation”. As of today, the stock rotation theme seems to be still in play. With reference to my 24 Feb 2017 write-up, I mentioned that I hope to reduce my overall percentage invested by selling some stocks in the next two weeks. As some of the stocks have not moved higher post their results, I continue to hold them. In fact, I have bought some shares and raised my percentage invested from 103% on 24 Feb 2017 to 129% (with the help of CFDs) on 10 Mar 2017. I may raise my percentage invested temporarily to 150% as there may be stocks to accumulate with potential near term catalysts. (My clients have, will & are informed on new stocks which I have entered and upon any significant portfolio change.)
My above decision to potentially raise my percentage invested to 150% is made with the conscious awareness of the following points:
a) It is a fact that S&P500 and STI have a good run since Nov 2016. There may be some form of consolidation or profit taking in March. By being >100% invested at this time, there are considerable risks to contend with;
b) There are fewer stock catalysts going into March as most companies would have reported their results;
c) U.S. debt ceiling will come into debate next month when the latest suspension of the limit expires on March 15. Furthermore, there is a FOMC meeting on 16 March.
d) According to an article on Bloomberg, S&P500 index is trading at 3x P/BV, the highest since 2004;
e) S&P500 is eerily clam and it has not experienced a 1% drop for the past 103 days.
Notwithstanding points a to e above, based on the current chart information, I do not foresee a correction in the near term. (Correction is typically defined as a 10% drop from S&P500’s recent high of 2,401). Nevertheless, as I am a remisier, I can tweak my percentage invested fairly quickly.
Readers who wish to be notified of my write-ups and / or informative emails, can consider signing up at http://ernest15percent.com. However, this reader’s mailing list has a one or two-day lag time as I will (naturally) send information (more information, more emails with more details) to my clients first. For readers who wish to enquire on being my client, they can consider to leave their contacts here http://ernest15percent.com/index.php/about-me/
Lastly, many new clients have asked me how I screen and decide which companies to take a closer look / write. To understand more about my basis of deciding which companies to write, you can download a copy of my eBook available on my website HERE.
P.S: Do note that as I am a full time remisier, I can change my equity allocation fast to capitalize on the markets’ movements.
Disclaimer
Please refer to the disclaimer HERE