Pursuant to my previous write-up on 23 May 2017 (click HERE for the earlier write-up) citing the oversold nature on Hatten’s chart, Hatten has surged 20.2% from $0.183 on 23 May 2017 to close $0.220 on 10 Jul 2017.
Hatten’s chart looks positive on several fronts.
Chart analysis
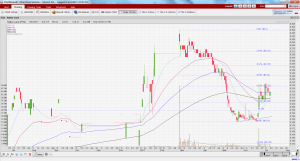
Based on Chart 1 below, Hatten’s chart seems to have several positives.
a) It is evident that the recent price increase is accompanied with volume. On the days which Hatten falls, it is accompanied with lower than average volume;
b) A double bottom formation seems to have formed with the neckline breakout at $0.205 on 22 Jun 2017 and hit an intraday high of $0.230. This is followed by a retreat to $0.205 before rebounding to around $0.215. A double bottom formation is a reversal pattern and this likely signifies that the medium term downtrend since late Feb 2017 is over;
c) To corroborate this double bottom formation, indicators such as MACD, RSI and MFI have shown bullish divergences even before the completion of the double bottom formation;
d) ADX has been rising amid positively placed directional indicators, signifying the presence of a trend.
e) All the exponential moving averages (“EMAs”) have either stopped declining or have started to rise. In fact, 20D EMA is on the verge of forming a golden cross with 50D and 200D EMA. 50D EMA is also on the verge of forming a golden cross with 200D EMA.
Near term supports: $0.210 / 0.205 / 0.197
Near term resistances: $0.230 / 0.240 / 0.250
Chart 1: Looks positive
Source: Chartnexus as of 10 Jul 17
Some technical experts also have a positive view on Hatten
On 4 July and 5 Jul 2017, CIMB Securities and UOB Kayhian have separately issued technical buy calls on Hatten. CIMB Securities cited that “aggressive traders may buy now (at the time of report, Hatten was trading at $0.230), or during pull-back to ($0.215-0.225) with a stop loss place below $0.205.”
UOB Kayhian wrote that “the breakaway gap, with comparatively high trading volume on 22 June, solidifies the stock’s bullish stance. $0.265 remains an important resistance”
Conclusion
This write-up revolves around Hatten’s chart as its chart has caught my attention. It is important to assess the share price performance in the next couple of days as 11 Jul and 12 Jul are T+6 and T+7 of the surge seen on 3 Jul 2017. A sustained breakout at $0.230 with volume points to an eventual measured technical target price of around $0.250. A sustained breakdown below $0.205 with volume negates the bullish tinge in the chart.
For fundamental research, readers should refer to the various research reports on Hatten. FYI, analysts’ target prices range from $0.380 – 0.440.
P.S: I am vested in Hatten.
Disclaimer
Please refer to the disclaimer HERE

Wow, wonderful blog format! How long have you ever been running a blog for?
you make blogging glance easy. The whole glance of your website is excellent, let alone the content!
You can see similar here sklep