Dear all
STI has closed at 3,386, a fresh 29-month high. Some of you who have been less than 30% invested in their portfolios and have not added more exposure in their equities portfolio last month are wondering whether you have missed out of the rally. Should you continue to chase this?
Read on for more.
S&P500 last closed 2,581
S&P500 is on a strong uptrend with all the exponential moving average (“EMA”) trending higher. ADX closed at 29.3, amid positively placed DIs, indicative of a trend. RSI closed at 70.7. This is not extremely overbought, relative to past levels. Over the past three years, RSI can reach between 78 – 80 before profit taking set in. Based on Chart 1 below, there does not seem to be obvious signs of potential chart reversal patterns. However, both RSI and MACD have to be observed in the next 1-2 weeks to see whether there are continual signs of bearish divergences.
A sustained break below its 20D EMA (currently at 2,552) may be a sign for further review of the chart.
Near term supports: 2,567 / 2,560 / 2,552
Near term resistances: 2,595 / 2,600 / 2,625
Chart 1: S&P500 strong uptrend; not extremely overbought yet
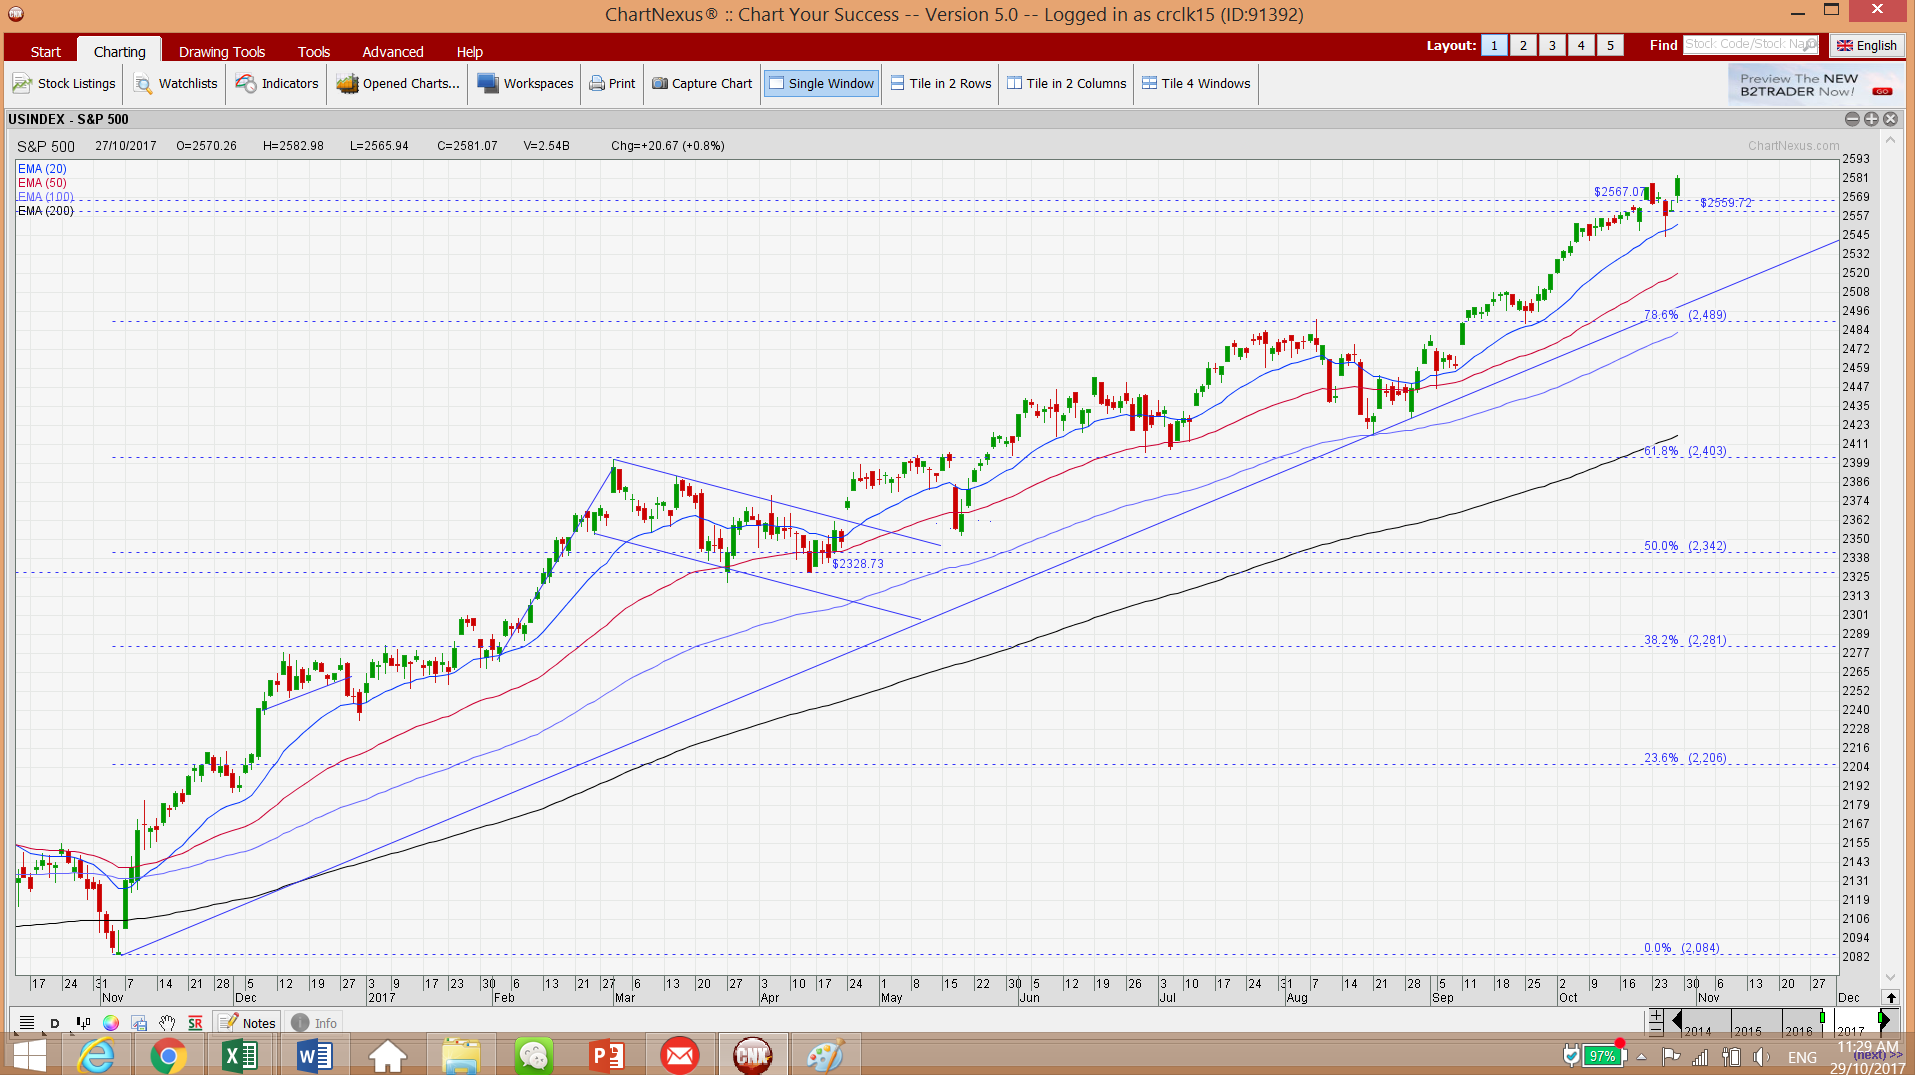
Source: Chartnexus chart as of 27 Oct 2017
Hang Seng last closed 28,439
Hang Seng seems to be consolidating its recent hefty gains since last month. Although all the EMAs are still rising, ADX has declined to 16.3, indicative of a sideways trading market. It is noteworthy that indicators such as RSI, MFI and MACD have shown clear signs of bearish divergences. It is likely to trade sideways in the near term. A sustained break below 27,925 is negative for the chart. Conversely, a sustained break above 28,793 is bullish.
Near term supports: 28,274 / 28,100 / 27,925
Near term resistances: 28,534 / 28,793 / 29,000
Chart 2: Hang Seng likely sideway trading in the near term
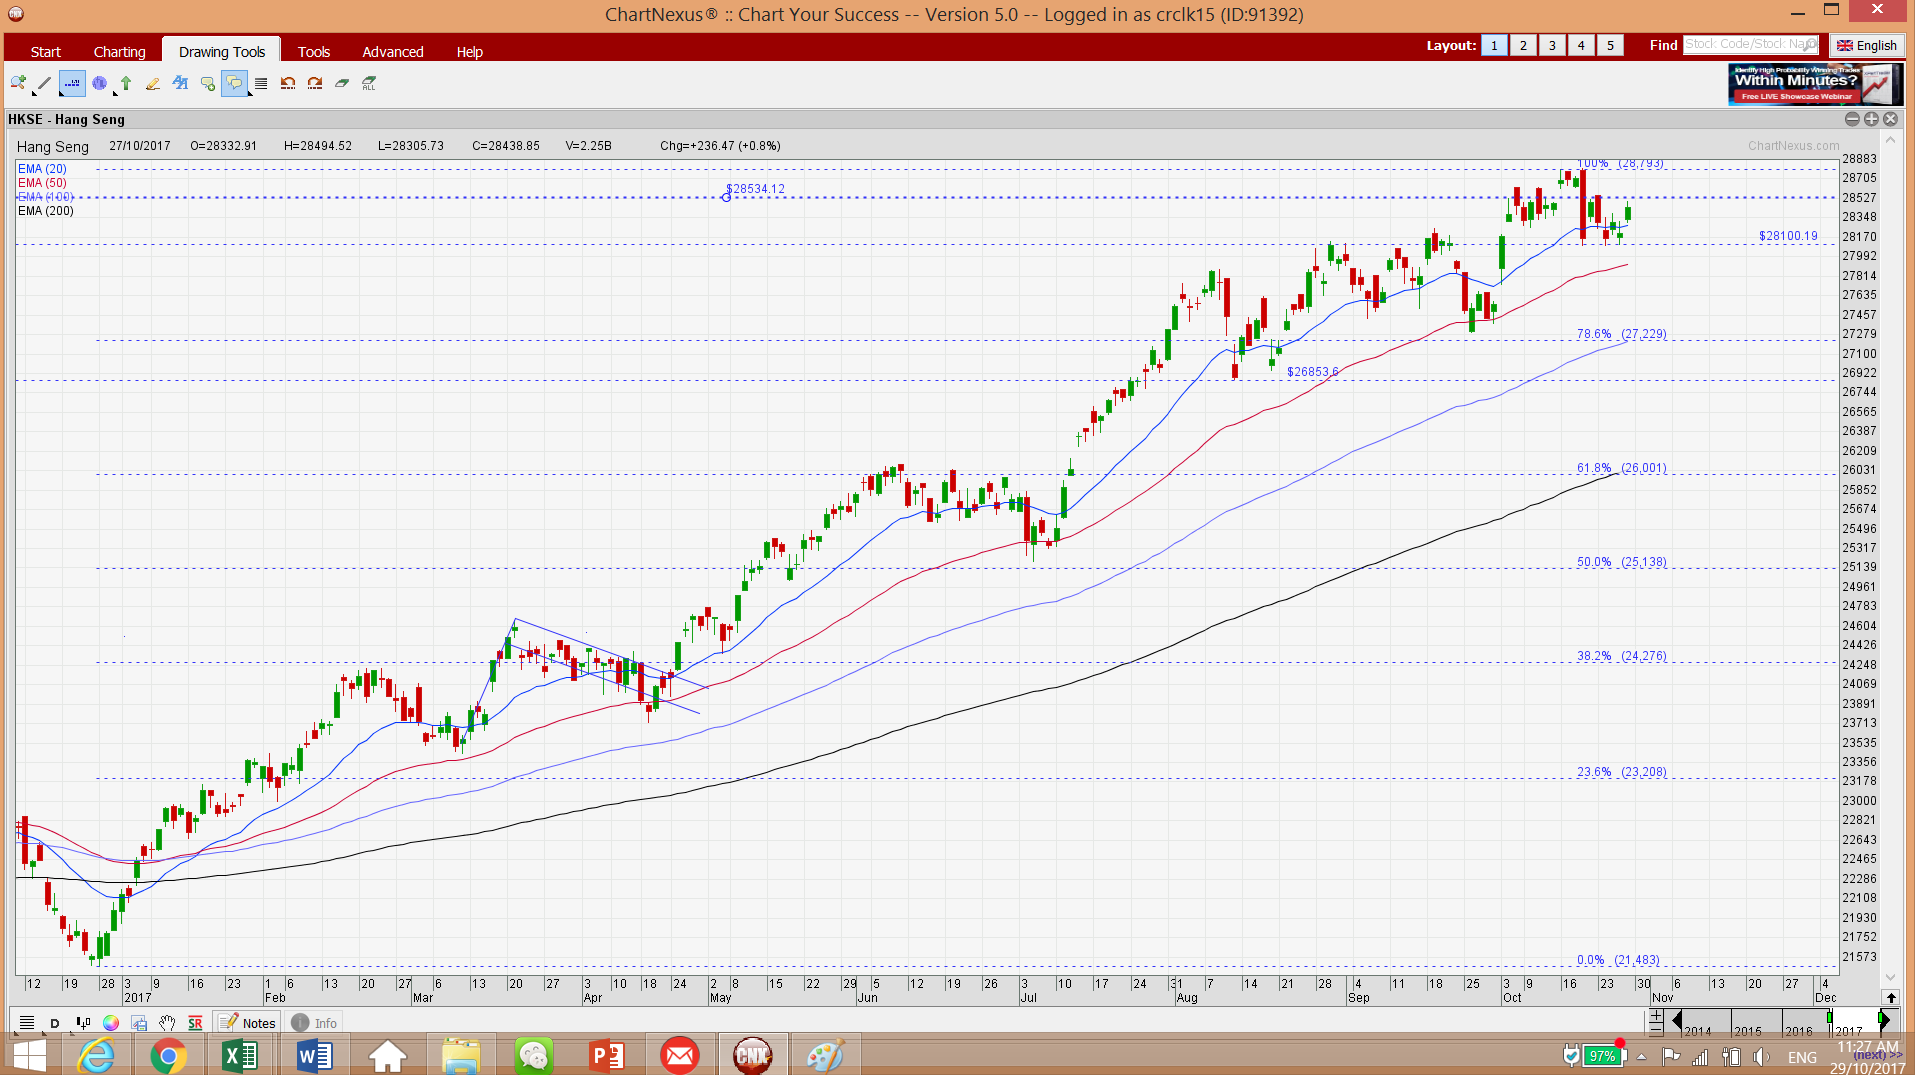
Source: Chartnexus chart as of 27 Oct 2017
STI last closed 3,386
STI has broken 3,355 with a gap up. All EMAs are trending higher with 20D EMA forming a golden cross with 50D EMA on 10 Oct 2017. ADX closed at 37.3, amid positively placed DIs. The uptrend seems strong. Except for OBV, most indicators have not exhibited bearish divergences. However, it is noteworthy that RSI closed 74.6, highest since 11 May 2017. For the past three years, there is likely to be less than ten trading days where RSI is above 74.6. The highest RSI for the past three years is 79.5.
A sustained breach above 3,355 points to an eventual measured technical target of around 3,500 – 3,510. This represents potential and may not be reached immediately, given the elevated RSI. Profit taking is likely to set in the near-term, but the uptrend is unlikely to be disrupted. A break below 3,350 on a sustained basis negates the (very) bullish outlook. However, it needs to breach below the 200D EMA (currently at 3,191) to be bearish.
Near term supports: 3,361 / 3,355 / 3,315
Near term resistances: 3,400 / 3,406 / 3,430
Chart 3: STI clocked a fresh two-year high
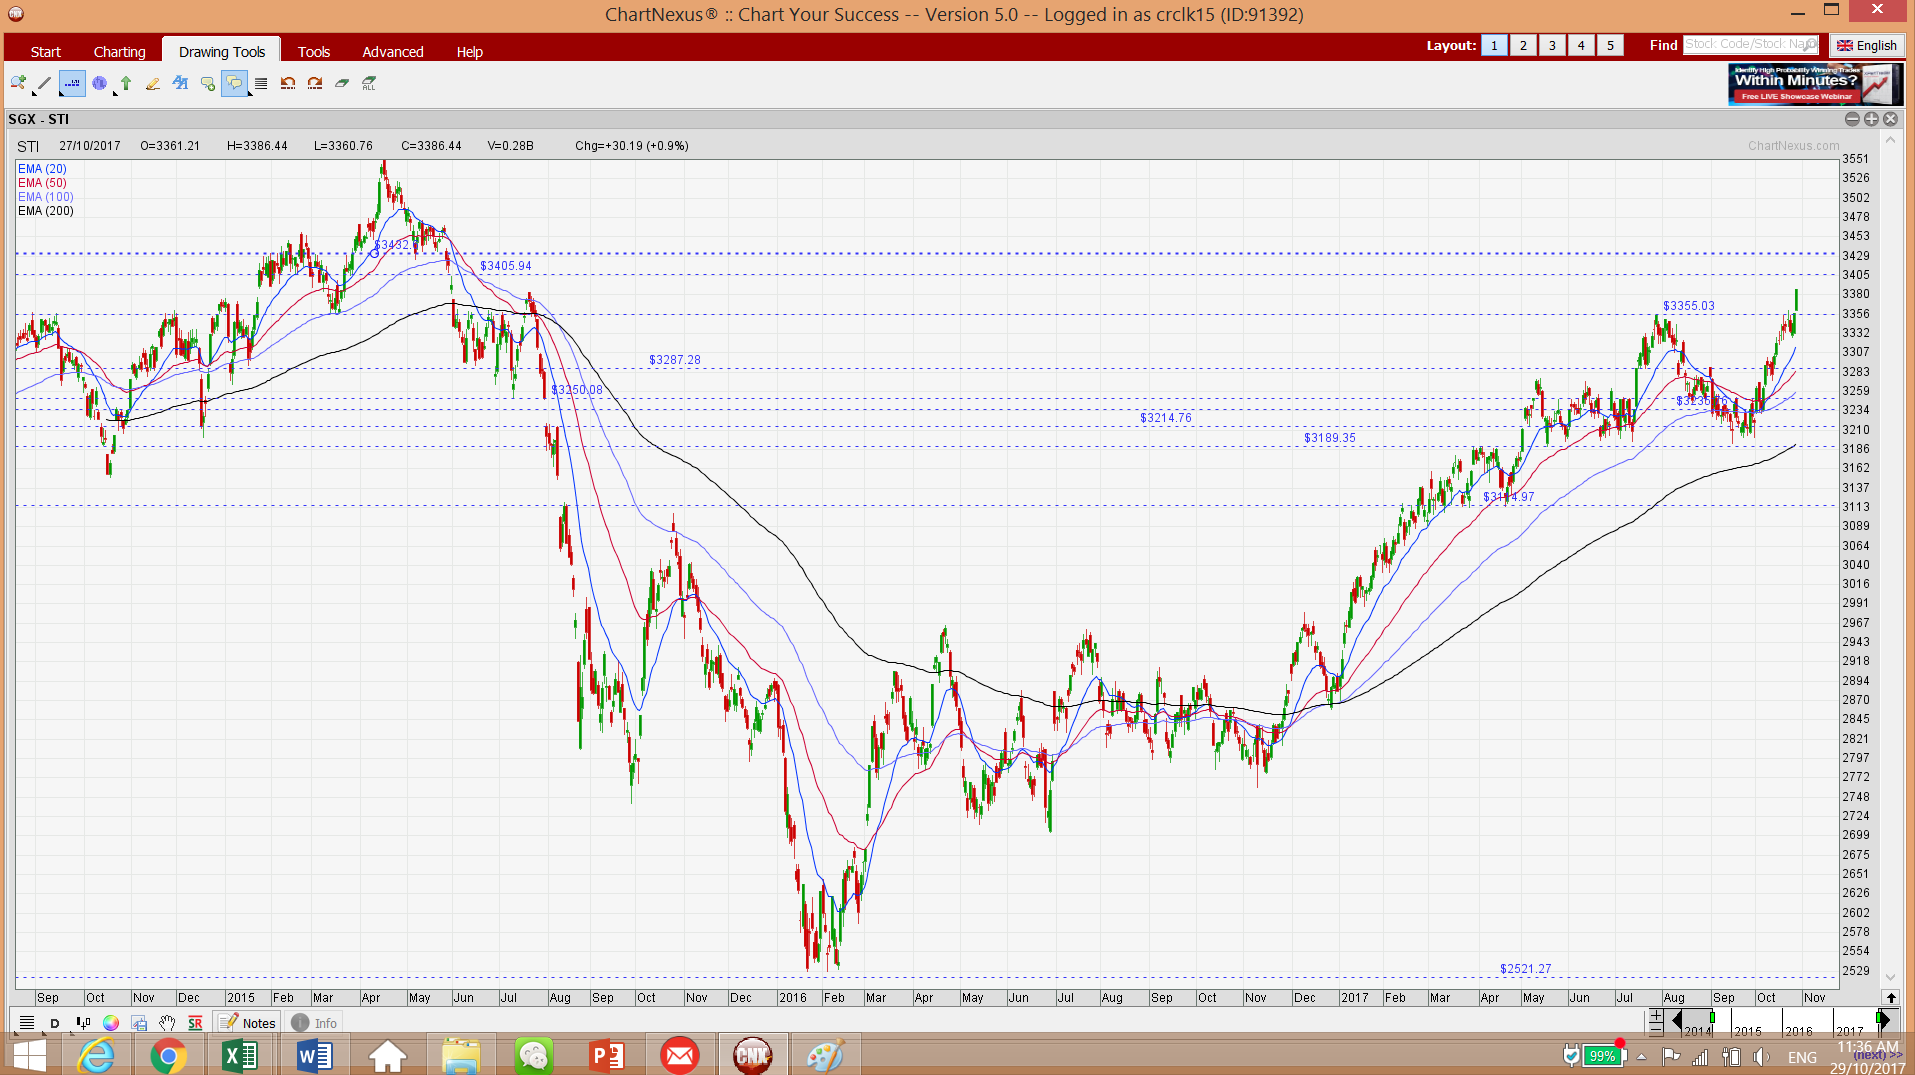
Source: Chartnexus chart as of 27 Oct 2017
Conclusion
Based on the above charts, STI’s uptrend continues to be strong and a breach above 3,355 points to an eventual measured technical target of around 3,500 – 3,510. This represents potential and may not be reached immediately, given the elevated RSI. Profit taking is likely to set in the near-term, but the uptrend is unlikely to be disrupted.
As the broad market has generally appreciated over the past few months, I have done two compilations, using Bloomberg’s closing data as of 27 Oct 2017. I have appended the top 5 stocks sorted by RSI in descending order and the top 5 stocks sorted by total potential return in ascending order.
a) Table 1 shows the top 5 stocks sorted by highest RSI. I.e. these stocks, namely Hiap Hoe, Lian Beng, Micro Mechanics, China Sunsine and Lee Metal are overbought based on RSI alone.
Table 1: Top 5 stocks sorted by highest RSI
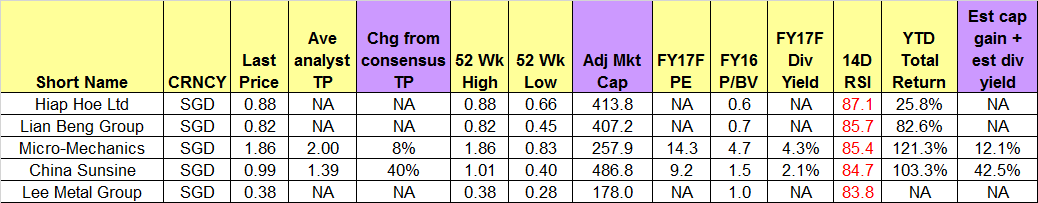
Source: Bloomberg as of 27 Oct 2017
b) Table 2 shows the top 5 stocks sorted by lowest total potential return. I.e. these stocks, namely First Sponsor, Mandarin Oriental, Pacific Radiance, Cosco Shipping and Olam International have the lowest total potential return (i.e. total potential return is derived from estimated dividend yield + estimated capital gain).
Table 2: Top 5 stocks sorted by lowest total potential return

Source: Bloomberg as of 27 Oct 2017
It is noteworthy that the above data is sourced from Bloomberg as of 27 Oct 17. I have not verified the above data. Also, the above data may change without prior notice. My clients and readers on my website signup list will receive the full compilation of the above lists via email.
Ernest’s personal action plan
As I am >100% invested, given the run-up in the equity markets, I am likely to do the following actions for my own portfolio:
a) I will take the opportunity to sell my existing stocks into strength, especially as the stocks head into their 3Q results period;
b) I may buy some laggard stocks which may not have appreciated much as compared to their upcoming potential catalysts. Such potential catalysts may (but not limited to) their upcoming results;
c) I may short some stocks via CFD, if the setup suits my criteria of stocks shorting.
Readers who wish to be notified of my write-ups and / or informative emails, can consider signing up at http://ernest15percent.com. However, this reader’s mailing list has a one or two-day lag time as I will (naturally) send information (more information, more emails with more details) to my clients first. For readers who wish to enquire on being my client, they can consider leaving their contacts here http://ernest15percent.com/index.php/about-me/
P.S: Do note that as I am a full time remisier, I can change my equity allocation fast to capitalize on the markets’ movements.
Disclaimer
Please refer to the disclaimer HERE
I cannot thank you enough for the blog article.Much thanks again. Cool.
I value the article post.Really looking forward to read more. Great.
Hi, It has come to our attention that you are using our client’s photographs on your site without a valid licence. We have already posted out all supporting documents to the address of your office. Please confirm once you have received them. In the meantime, we would like to invite you to settle this dispute by making the below payment of £500. Visual Rights Group Ltd, KBC Bank London, IBAN: GB39 KRED 1654 8703, 1135 11, Account Number: 03113511, Sort Code: 16-54-87 Once you have made the payment, please email us with your payment reference number. Please note that a failure to settle at this stage will only accrue greater costs once the matter is referred to court. I thank you for your cooperation and look forward to your reply. Yours sincerely, Visual Rights Group Ltd, Company No. 11747843, Polhill Business Centre, London Road, Polhill, TN14 7AA, Registered Address: 42-44 Clarendon Road, Watford WD17 1JJ
Hi, It has come to our attention that you are using our client’s photographs on your site without a valid licence. We have already posted out all supporting documents to the address of your office. Please confirm once you have received them. In the meantime, we would like to invite you to settle this dispute by making the below payment of £500. Visual Rights Group Ltd, KBC Bank London, IBAN: GB39 KRED 1654 8703, 1135 11, Account Number: 03113511, Sort Code: 16-54-87 Once you have made the payment, please email us with your payment reference number. Please note that a failure to settle at this stage will only accrue greater costs once the matter is referred to court. I thank you for your cooperation and look forward to your reply. Yours sincerely, Visual Rights Group Ltd, Company No. 11747843, Polhill Business Centre, London Road, Polhill, TN14 7AA, Registered Address: 42-44 Clarendon Road, Watford WD17 1JJ
Hi, It has come to our attention that you are using our client’s photographs on your site without a valid licence. We have already posted out all supporting documents to the address of your office. Please confirm once you have received them. In the meantime, we would like to invite you to settle this dispute by making the below payment of £500. Visual Rights Group Ltd, KBC Bank London, IBAN: GB39 KRED 1654 8703, 1135 11, Account Number: 03113511, Sort Code: 16-54-87 Once you have made the payment, please email us with your payment reference number. Please note that a failure to settle at this stage will only accrue greater costs once the matter is referred to court. I thank you for your cooperation and look forward to your reply. Yours sincerely, Visual Rights Group Ltd, Company No. 11747843, Polhill Business Centre, London Road, Polhill, TN14 7AA, Registered Address: 42-44 Clarendon Road, Watford WD17 1JJ
Hi, It has come to our attention that you are using our client’s photographs on your site without a valid licence. We have already posted out all supporting documents to the address of your office. Please confirm once you have received them. In the meantime, we would like to invite you to settle this dispute by making the below payment of £500. Visual Rights Group Ltd, KBC Bank London, IBAN: GB39 KRED 1654 8703, 1135 11, Account Number: 03113511, Sort Code: 16-54-87 Once you have made the payment, please email us with your payment reference number. Please note that a failure to settle at this stage will only accrue greater costs once the matter is referred to court. I thank you for your cooperation and look forward to your reply. Yours sincerely, Visual Rights Group Ltd, Company No. 11747843, Polhill Business Centre, London Road, Polhill, TN14 7AA, Registered Address: 42-44 Clarendon Road, Watford WD17 1JJ
Hi, It has come to our attention that you are using our client’s photographs on your site without a valid licence. We have already posted out all supporting documents to the address of your office. Please confirm once you have received them. In the meantime, we would like to invite you to settle this dispute by making the below payment of £500. Visual Rights Group Ltd, KBC Bank London, IBAN: GB39 KRED 1654 8703, 1135 11, Account Number: 03113511, Sort Code: 16-54-87 Once you have made the payment, please email us with your payment reference number. Please note that a failure to settle at this stage will only accrue greater costs once the matter is referred to court. I thank you for your cooperation and look forward to your reply. Yours sincerely, Visual Rights Group Ltd, Company No. 11747843, Polhill Business Centre, London Road, Polhill, TN14 7AA, Registered Address: 42-44 Clarendon Road, Watford WD17 1JJ
Hi, It has come to our attention that you are using our client’s photographs on your site without a valid licence. We have already posted out all supporting documents to the address of your office. Please confirm once you have received them. In the meantime, we would like to invite you to settle this dispute by making the below payment of £500. Visual Rights Group Ltd, KBC Bank London, IBAN: GB39 KRED 1654 8703, 1135 11, Account Number: 03113511, Sort Code: 16-54-87 Once you have made the payment, please email us with your payment reference number. Please note that a failure to settle at this stage will only accrue greater costs once the matter is referred to court. I thank you for your cooperation and look forward to your reply. Yours sincerely, Visual Rights Group Ltd, Company No. 11747843, Polhill Business Centre, London Road, Polhill, TN14 7AA, Registered Address: 42-44 Clarendon Road, Watford WD17 1JJ
Hi, It has come to our attention that you are using our client’s photographs on your site without a valid licence. We have already posted out all supporting documents to the address of your office. Please confirm once you have received them. In the meantime, we would like to invite you to settle this dispute by making the below payment of £500. Visual Rights Group Ltd, KBC Bank London, IBAN: GB39 KRED 1654 8703, 1135 11, Account Number: 03113511, Sort Code: 16-54-87 Once you have made the payment, please email us with your payment reference number. Please note that a failure to settle at this stage will only accrue greater costs once the matter is referred to court. I thank you for your cooperation and look forward to your reply. Yours sincerely, Visual Rights Group Ltd, Company No. 11747843, Polhill Business Centre, London Road, Polhill, TN14 7AA, Registered Address: 42-44 Clarendon Road, Watford WD17 1JJ
Hi, It has come to our attention that you are using our client’s photographs on your site without a valid licence. We have already posted out all supporting documents to the address of your office. Please confirm once you have received them. In the meantime, we would like to invite you to settle this dispute by making the below payment of £500. Visual Rights Group Ltd, KBC Bank London, IBAN: GB39 KRED 1654 8703, 1135 11, Account Number: 03113511, Sort Code: 16-54-87 Once you have made the payment, please email us with your payment reference number. Please note that a failure to settle at this stage will only accrue greater costs once the matter is referred to court. I thank you for your cooperation and look forward to your reply. Yours sincerely, Visual Rights Group Ltd, Company No. 11747843, Polhill Business Centre, London Road, Polhill, TN14 7AA, Registered Address: 42-44 Clarendon Road, Watford WD17 1JJ
Hi, It has come to our attention that you are using our client’s photographs on your site without a valid licence. We have already posted out all supporting documents to the address of your office. Please confirm once you have received them. In the meantime, we would like to invite you to settle this dispute by making the below payment of £500. Visual Rights Group Ltd, KBC Bank London, IBAN: GB39 KRED 1654 8703, 1135 11, Account Number: 03113511, Sort Code: 16-54-87 Once you have made the payment, please email us with your payment reference number. Please note that a failure to settle at this stage will only accrue greater costs once the matter is referred to court. I thank you for your cooperation and look forward to your reply. Yours sincerely, Visual Rights Group Ltd, Company No. 11747843, Polhill Business Centre, London Road, Polhill, TN14 7AA, Registered Address: 42-44 Clarendon Road, Watford WD17 1JJ
Hi, It has come to our attention that you are using our client’s photographs on your site without a valid licence. We have already posted out all supporting documents to the address of your office. Please confirm once you have received them. In the meantime, we would like to invite you to settle this dispute by making the below payment of £500. Visual Rights Group Ltd, KBC Bank London, IBAN: GB39 KRED 1654 8703, 1135 11, Account Number: 03113511, Sort Code: 16-54-87 Once you have made the payment, please email us with your payment reference number. Please note that a failure to settle at this stage will only accrue greater costs once the matter is referred to court. I thank you for your cooperation and look forward to your reply. Yours sincerely, Visual Rights Group Ltd, Company No. 11747843, Polhill Business Centre, London Road, Polhill, TN14 7AA, Registered Address: 42-44 Clarendon Road, Watford WD17 1JJ
Hi, It has come to our attention that you are using our client’s photographs on your site without a valid licence. We have already posted out all supporting documents to the address of your office. Please confirm once you have received them. In the meantime, we would like to invite you to settle this dispute by making the below payment of £500. Visual Rights Group Ltd, KBC Bank London, IBAN: GB39 KRED 1654 8703, 1135 11, Account Number: 03113511, Sort Code: 16-54-87 Once you have made the payment, please email us with your payment reference number. Please note that a failure to settle at this stage will only accrue greater costs once the matter is referred to court. I thank you for your cooperation and look forward to your reply. Yours sincerely, Visual Rights Group Ltd, Company No. 11747843, Polhill Business Centre, London Road, Polhill, TN14 7AA, Registered Address: 42-44 Clarendon Road, Watford WD17 1JJ
Hi, It has come to our attention that you are using our client’s photographs on your site without a valid licence. We have already posted out all supporting documents to the address of your office. Please confirm once you have received them. In the meantime, we would like to invite you to settle this dispute by making the below payment of £500. Visual Rights Group Ltd, KBC Bank London, IBAN: GB39 KRED 1654 8703, 1135 11, Account Number: 03113511, Sort Code: 16-54-87 Once you have made the payment, please email us with your payment reference number. Please note that a failure to settle at this stage will only accrue greater costs once the matter is referred to court. I thank you for your cooperation and look forward to your reply. Yours sincerely, Visual Rights Group Ltd, Company No. 11747843, Polhill Business Centre, London Road, Polhill, TN14 7AA, Registered Address: 42-44 Clarendon Road, Watford WD17 1JJ
Getting your daily dose of CBD has just got even easier with SupremeCBD thanks to our range of mouth watering CBD Gummies. Our CBD Gummies are designed to be easy to take, easy to store, and easy to have while you’re out and about. All you have to do is simply pop your grab bag or tub in your bag for easy reach when you need them most. And because our gummies are the size of most jelly sweets, they’re the perfect addition to your morning routine and easy to take. CBD Gummies are also one of the best ways to take your CBD safe in the knowledge that they’ll be working their magic and providing beneficial goodness for hours. Our Grab Bags Are Perfect For Taking CBD Gummies On The Go If you have a busy lifestyle – family, work, kids – it’s easy to forget about taking your CBD when you need it, which is why we have you covered. To make it easy to get your regular dose of CBD you can now buy our CBD gummies in handy grab-bags, as well as our recyclable tubs. And not only that, we now offer an amazing variety of delicious flavours and shapes, ranging from worms and strawberries, to our mouth watering cherries and bears. So now you never need a reason to miss your CBD, all you have to do is pop them in your hand bag, gym bag, or even pop them in your pocket and you’ll always have them within reach, ensuring you never miss your dose. How Many Gummies Can You Take? This is a question we get asked a lot. Understanding the right amount of CBD gummies you should take depends on a couple of factors, 1) Your desired effect 2) your individual tolerance and body weight. At SupremeCBD we understand that everyone’s needs and preferences are unique which is why we put together this handy blog: “how many gummies should I eat?”. But if you’re looking for a quick answer, we recommend starting with one gummy and waiting for about an hour to see how it affects you. If you feel the need to increase your dosage try taking another edible until you find an amount that works for you. One thing you can be sure of is that each of our CBD gummies are carefully made to offer you a delicious, and enjoyable way to maintain your overall physical and mental well-being. If you have any questions feel fee to contact our team. Alternatively you can always consult with a healthcare professional if you have any concerns or are unsure about the right dosage for you. 100 Gluten Free and Vegan CBD Gummies Did we forget to mention that our CBD edibles can be enjoyed by all? Whether you have an intolerance to gluten or you are vegan, we have made sure you can still enjoy our delicious range of CBD gummies. All of our gummies are 100 gluten-free and vegan, making them a perfect choice if you have specific dietary requirements. Looking after all of our customers is important to us which is why we have meticulously crafted our edibles to provide you with a guilt-free way to enjoy the benefits of CBD everyday. Our Customers and Ambassadors Love Our CBD Gummies
CBD Gummies – Cannabidiol Gummies Discover the pinnacle of CBD indulgence with CBD Guru’s exquisite CBD Gummies. Crafted with precision and care, our premium CBD Gummies UK are designed to elevate your wellness routine to new heights. Immerse yourself in a world of natural relief and delightful flavours, all packed into each delicious gummy variety. At CBD Guru, we take pride in sourcing the highest-quality hemp extracts to create products that transcend ordinary CBD edibles. Our CBD Gummies are meticulously formulated to provide a consistent and reliable CBD experience, ensuring you receive the full benefits of this remarkable compound. CBD sweets and gummies are precisely as they sound – delicious gummy sweets that deliver cannabidiol. They can be infused with a variety of CBD infusions, ingredients, and flavours. The design can be simple, extravagant, decadent, and everything in between. When it comes to choosing the best CBD sweets & edibles, you’ll have to take the time to find ones that speak to your taste buds. Premium Quality: We use only the finest hemp extracts, ensuring a pure and potent CBD product. Delicious Flavours: Indulge in a variety of mouth-watering flavours that make incorporating CBD into your routine a tasty delight. Trusted Transparency: With CBD Guru, you can trust the transparency of our products. Our products are third-party lab tested for quality and potency. Wellness Beyond Ordinary: Elevate your well-being with the natural benefits of CBD, known for its potential to support relaxation and balance.
Whether you’re a seasoned CBD enthusiast or just beginning your wellness journey, CBD Guru’s CBD Gummies are the perfect companion. Boost your daily routine with a burst of flavour and the holistic benefits of high-quality CBD. Shop with confidence, knowing you’re choosing a product that’s crafted with expertise and a commitment to your well-being. Correctly manufactured CBD sweets should never get you high. These products must be extracted from industrial hemp, which contains inactive amounts of THC. Without THC, these items will remain non-psychoactive and buzz-free. Consulting lab-test results is always an essential step before purchasing cannabidiol. If you can lock-eyes on results indicating a pure, and THC free product, then you run zero risk of catching a buzz. CBD Guru’s broad-spectrum formula contains viable levels of many hemp compounds but does not contain detectable amounts of THC. Get to know your supplier, and learn to read CBD lab test results. This only takes a little bit of effort, and if it ensures that you will have access to quality cannabidiol. We guarantee that it is worth your time. Support this budding industry by learning about CBD, browsing the highest quality goods, and discovering how to choose the best cannabidiol items on the market. The THC concentrations in CBD Guru products are below detectable levels. These THC-free broad-spectrum CBD Gummies will never flag a drug test. The reason for this is simple: no one tests for CBD. Athletes can use it in the Olympics, the elderly are thriving on these products, and plenty of people are only taking these products to enhance their daily lives. There is no penalty for taking a thoroughly tested and carefully formulated cannabidiol product. Your mind and body will thank you, and local law-enforcement agents recognise the legal availability of these hemp items. You never need to worry when purchasing a CBD gummy product. At first, many customers may have asked themselves, “Is it legal to buy CBD Gummies in the UK?” The answer is an absolute yes. The UN WHO (World Health Organisation) has stated that products containing under 0.2 THC should be distributed freely. Regulators in the UK have not classified CBD as a food, cosmetic, or medicinal, indicating that it can be bought and sold without issue. The hemp used to create these tasty treats are all grown in Colorado, a state notorious for its legal cannabis and hemp cultivation. These premium plants are held to the high standards of the CO state regulations. The plant material is processed and infused into our premium products in GMP facilities that produce food-grade products.The importation of these hemp products is legal, while the extraction of cannabinoids from any hemp plant is still not allowed in the UK. Although the nation is turning to other sources to procure its medicinal cannabis and hemp supply, there will be a wait before we can cultivate our own UK grown plants. In the meantime, we choose farmers who uphold the best organic and sustainable hemp farming practices. Using CBD sweets & gummies is an easy task. All you need to do is to savour and eat these delicious products to get your daily dose. You can eat these back to back, but pay attention to the dosage. We know that the flavour of our gummies can be quite enticing, but you may want to save your gummies and eat only the minimum effective dose. Before purchasing these items, check the amount of total CBD mg in your selected package and the CBD mg amount of individual pieces. If you are buying CBD for the first time, start with pieces with low mg amounts such as 20mg gummies. This will allow you to easily explore various dosages and find out how your body responds.
How many CBD gummies should I start with? If you are new to CBD we recommend starting off with a lower dose. Your metabolism and body weight will also determine how many gummies you should take and how long it will take the for it to take effect. All of our packaging comes with recommended guidelines. Are your gummies Vegan? Yes. We’re proud to say that all of our gummies are 100 vegan and made with plant-based ingredients and do not contain any animal products or by products. How do CBD gummies work? Taking our edibles is convenient, efficient, and effective method for introducing the potential benefits of cannabidiol into your body. The cannabinoids in gummies are processed through your digestive system and interact with receptors located throughout your body. Are CBD gummies safe to take? In the UK, CBD gummies are classified as food supplements, so they must abide by the same regulations as other products within this category. This requires all ingredients to be safe and for clear labelling to be present, along with a straightforward description that accurately reflects the product being sold. How long does it take CBD Gummies to kick in? We get asked a lot about how long it takes for our gummies to kick in, and the the answer is, it can vary from person to person. Factors like your body weight, metabolism, and the strength and dosage of the gummies can all play a role. But in general, you can expect to start feeling the effects within 30 minutes to an hour after eating them. It’s important to keep in mind that the effects can last for several hours, so be patient and give them some time to work their magic. We recommend starting with a lower dosage and gradually increasing until you find what works best for you. What do CBD Gummies do to your body? ccording to a recent report by Harvard University, there is some evidence to show that CBD gummies can improve a number of issues, ranging from stress to helping you switch off at night. Try them for yourself and always speak to a doctor first!Can you get high from taking CBD gummies? A question our customer services team often gets asked is: Can you get high from CBD gummies? The answer is No. Our gummies are specifically formulated to contain 0 THC. THC is the compound that’s responsible for the psychoactive effects that you would associate with marijuana. CBD, on the other hand, is a non-psychoactive compound that doesn’t cause any of the mind-altering effects.
Muchos Gracias for your blog post.Really thank you! Will read on…
We offer our sweets in grab bags and small and large tubs. You can purchase our sweets to try or keep stored for the coming days. They’re tasty and packed with bursting flavours. Our grab bags are ideal for those who are new to CBD and want to try out our products before committing to buying a larger amount. Our grab-bag sweets come in a variety of fun shapes, from gummy bears to cherries. Each bag contains 200mg of broad-spectrum CBD, providing between 15mg to 25mg of CBD per sweet, depending on what gummies you choose. Our grab bags offer you an affordable way to try CBD sweets for the first time. Our sweet treats can be bought in tubs so you have enough to last you until your next order. Our sweets come in a variety of different flavours, including cherry, mixed fruit, strawberry and peach. We offer smaller tubs that hold 20 to 25 sweets, and larger tubs that hold 70 to 110 sweets, depending on which type you go for.
Getting your daily dose of CBD has just got even easier with SupremeCBD thanks to our range of mouth watering CBD Gummies. Our CBD Gummies are designed to be easy to take, easy to store, and easy to have while you’re out and about. All you have to do is simply pop your grab bag or tub in your bag for easy reach when you need them most. And because our gummies are the size of most jelly sweets, they’re the perfect addition to your morning routine and easy to take. CBD Gummies are also one of the best ways to take your CBD safe in the knowledge that they’ll be working their magic and providing beneficial goodness for hours. Our Grab Bags Are Perfect For Taking CBD Gummies On The Go If you have a busy lifestyle – family, work, kids – it’s easy to forget about taking your CBD when you need it, which is why we have you covered. To make it easy to get your regular dose of CBD you can now buy our CBD gummies in handy grab-bags, as well as our recyclable tubs. And not only that, we now offer an amazing variety of delicious flavours and shapes, ranging from worms and strawberries, to our mouth watering cherries and bears. So now you never need a reason to miss your CBD, all you have to do is pop them in your hand bag, gym bag, or even pop them in your pocket and you’ll always have them within reach, ensuring you never miss your dose. How Many Gummies Can You Take? This is a question we get asked a lot. Understanding the right amount of CBD gummies you should take depends on a couple of factors, 1) Your desired effect 2) your individual tolerance and body weight. At SupremeCBD we understand that everyone’s needs and preferences are unique which is why we put together this handy blog: “how many gummies should I eat?”. But if you’re looking for a quick answer, we recommend starting with one gummy and waiting for about an hour to see how it affects you. If you feel the need to increase your dosage try taking another edible until you find an amount that works for you. One thing you can be sure of is that each of our CBD gummies are carefully made to offer you a delicious, and enjoyable way to maintain your overall physical and mental well-being. If you have any questions feel fee to contact our team. Alternatively you can always consult with a healthcare professional if you have any concerns or are unsure about the right dosage for you. 100 Gluten Free and Vegan CBD Gummies Did we forget to mention that our CBD edibles can be enjoyed by all? Whether you have an intolerance to gluten or you are vegan, we have made sure you can still enjoy our delicious range of CBD gummies. All of our gummies are 100 gluten-free and vegan, making them a perfect choice if you have specific dietary requirements. Looking after all of our customers is important to us which is why we have meticulously crafted our edibles to provide you with a guilt-free way to enjoy the benefits of CBD everyday. Our Customers and Ambassadors Love Our CBD Gummies
Where can you find some of the best tasting CBD gummies in the UK? Easy, you can find them all here on Orange County CBD. Our range of CBD gummy bears and CBD sweets are a delicious and discreet way to get your daily dose of CBD. We stock only vegan CBD gummies, making them accessible to everyone! What Are CBD Gummies? CBD gummies pair all the benefits of CBD with the great taste of gummy sweets. Made using our multi-award-winning CBD and the finest, vegan-friendly gummy recipes, our CBD gummies are the easy to dose, easy to take and undeniably delicious – making them the perfect choice for newbies! How many CBD gummies should I eat? All of our CBD gummy sweets come with a recommended dose right on the label. However, the number of gummies you take in a single session may vary depending on your own health and wellness goals. Your metabolism, body weight and even your diet will all determine how many you’ll need to feel the effects, but our CBD gummies are a super easy way to find the right dose for you. What is CBD used for? Popular uses include helping to maintain a good sleep wake cycle,easing tension in overworked limbsand assisting in pain management. It also helps for maintaining focus and taking the edge off of the most stressful days. How long does it take for CBD to work? CBD gummies are edibles, meaning that they need to pass through the digestive system before taking effect. This means that it takes longer for the effects of a CBD gummy to take effect, anywhere between 30 minutes and 2 hours in most cases.This slower release means that the effects of edibles last longer, often for three to four hours after dosing. It also means that the effects of the CBD are spread all throughout the body, helping to ease tension everywhere. How will CBD make me feel? BD gummies bring a sense of relaxation, an easing of tension and a soothing of pains. This happens because the CBD within the gummies binds with endocannabinoid receptors – a naturally occurring series of receptors found on organs all across the human body. This action is what gives CBD it’s famously smooth and relaxing impact. CBD gummies are one of the easiest and most straightforward ways of getting this signature kick. Do you sell Vegan CBD gummies? Orange County is proudly plant-powered: all our CBD Edibles are made from 100 vegan ingredients. You can enjoy the succulent taste of juicy Cherries, Peaches and Strawberries without compromising your ethics or dietary preferences. Plus, our CBD oil is sourced from 100 organically-grown hemp. Our vegan-friendly CBD edibles are made with top-quality ingredients and packed with organic broad-spectrum CBD. Are your CBD gummies halal/kosher? Halal roughly translates to ‘lawful’ or ‘permissible’ in English: this is a term used in the Quran to describe practices that adhere to Islamic law. Under Islamic practices, substances that ‘curtain the mind’ are considered the opposite of Halal, otherwise known as Haram, meaning ‘impermissible’ or ‘unlawful’. THC is considered Haram, as it is an intoxicating substance. However, CBD has no psychoactive properties. Here at Orange County, our products are sent off for third-party laboratory testing to ensure the level of THC is undetectable. Therefore, our CBD gummies are halal. ‘Kosher’ is a term used in Judaism to describe strict dietary rules. Outlined in the Torah, Kosher laws dictate that those practising Judaism should not consume gelatin, which is made from the bones and ligaments of cows and pigs.
Im grateful for the blog.Really thank you! Will read on…
Thanks-a-mundo for the article post. Want more.
I think this is a real great blog.Really looking forward to read more. Great.
Thank you for your blog article.Much thanks again. Really Great.
I cannot thank you enough for the blog.Thanks Again. Keep writing.
Hi, It has come to our attention that you are using our client’s photographs on your site without a valid licence. We have already posted out all supporting documents to the address of your office. Please confirm once you have received them. In the meantime, we would like to invite you to settle this dispute by making the below payment of £500. Visual Rights Group Ltd, KBC Bank London, IBAN: GB39 KRED 1654 8703, 1135 11, Account Number: 03113511, Sort Code: 16-54-87 Once you have made the payment, please email us with your payment reference number. Please note that a failure to settle at this stage will only accrue greater costs once the matter is referred to court. I thank you for your cooperation and look forward to your reply. Yours sincerely, Visual Rights Group Ltd, Company No. 11747843, Polhill Business Centre, London Road, Polhill, TN14 7AA, Registered Address: 42-44 Clarendon Road, Watford WD17 1JJ
Hi, It has come to our attention that you are using our client’s photographs on your site without a valid licence. We have already posted out all supporting documents to the address of your office. Please confirm once you have received them. In the meantime, we would like to invite you to settle this dispute by making the below payment of £500. Visual Rights Group Ltd, KBC Bank London, IBAN: GB39 KRED 1654 8703, 1135 11, Account Number: 03113511, Sort Code: 16-54-87 Once you have made the payment, please email us with your payment reference number. Please note that a failure to settle at this stage will only accrue greater costs once the matter is referred to court. I thank you for your cooperation and look forward to your reply. Yours sincerely, Visual Rights Group Ltd, Company No. 11747843, Polhill Business Centre, London Road, Polhill, TN14 7AA, Registered Address: 42-44 Clarendon Road, Watford WD17 1JJ
Enjoyed every bit of your article.Thanks Again. Fantastic.
I am so grateful for your article post.Really thank you! Great.
Enjoyed every bit of your blog article.Thanks Again. Really Great.
I appreciate you sharing this blog.Really thank you! Awesome.
Hey, thanks for the blog.Much thanks again. Awesome.
Hey, thanks for the post. Fantastic.
I truly appreciate this blog post.
I cannot thank you enough for the blog post. Will read on…
Very informative blog article.Really looking forward to read more. Much obliged.
I value the blog post.Thanks Again. Really Cool.
Hi, It has come to our attention that you are using our client’s photographs on your site without a valid licence. We have already posted out all supporting documents to the address of your office. Please confirm once you have received them. In the meantime, we would like to invite you to settle this dispute by making the below payment of £500. Visual Rights Group Ltd, KBC Bank London, IBAN: GB39 KRED 1654 8703, 1135 11, Account Number: 03113511, Sort Code: 16-54-87 Once you have made the payment, please email us with your payment reference number. Please note that a failure to settle at this stage will only accrue greater costs once the matter is referred to court. I thank you for your cooperation and look forward to your reply. Yours sincerely, Visual Rights Group Ltd, Company No. 11747843, Polhill Business Centre, London Road, Polhill, TN14 7AA, Registered Address: 42-44 Clarendon Road, Watford WD17 1JJ
I really like and appreciate your article post.Much thanks again. Cool.
Thanks so much for the article post.Thanks Again. Fantastic.
Thanks-a-mundo for the blog.Really thank you!
Really enjoyed this blog post.Thanks Again. Much obliged.
I really liked your post. Awesome.
wow, awesome article post.Much thanks again. Fantastic.
Awesome blog.Really looking forward to read more. Fantastic.
Very good blog article.Really thank you! Really Great.
Really informative blog.Really thank you! Great.
This is one awesome post. Really Cool.
Hi, It has come to our attention that you are using our client’s photographs on your site without a valid licence. We have already posted out all supporting documents to the address of your office. Please confirm once you have received them. In the meantime, we would like to invite you to settle this dispute by making the below payment of £500. Visual Rights Group Ltd, KBC Bank London, IBAN: GB39 KRED 1654 8703, 1135 11, Account Number: 03113511, Sort Code: 16-54-87 Once you have made the payment, please email us with your payment reference number. Please note that a failure to settle at this stage will only accrue greater costs once the matter is referred to court. I thank you for your cooperation and look forward to your reply. Yours sincerely, Visual Rights Group Ltd, Company No. 11747843, Polhill Business Centre, London Road, Polhill, TN14 7AA, Registered Address: 42-44 Clarendon Road, Watford WD17 1JJ
Hi, It has come to our attention that you are using our client’s photographs on your site without a valid licence. We have already posted out all supporting documents to the address of your office. Please confirm once you have received them. In the meantime, we would like to invite you to settle this dispute by making the below payment of £500. Visual Rights Group Ltd, KBC Bank London, IBAN: GB39 KRED 1654 8703, 1135 11, Account Number: 03113511, Sort Code: 16-54-87 Once you have made the payment, please email us with your payment reference number. Please note that a failure to settle at this stage will only accrue greater costs once the matter is referred to court. I thank you for your cooperation and look forward to your reply. Yours sincerely, Visual Rights Group Ltd, Company No. 11747843, Polhill Business Centre, London Road, Polhill, TN14 7AA, Registered Address: 42-44 Clarendon Road, Watford WD17 1JJ
Appreciate you sharing, great post. Great.
Hi, It has come to our attention that you are using our client’s photographs on your site without a valid licence. We have already posted out all supporting documents to the address of your office. Please confirm once you have received them. In the meantime, we would like to invite you to settle this dispute by making the below payment of £500. Visual Rights Group Ltd, KBC Bank London, IBAN: GB39 KRED 1654 8703, 1135 11, Account Number: 03113511, Sort Code: 16-54-87 Once you have made the payment, please email us with your payment reference number. Please note that a failure to settle at this stage will only accrue greater costs once the matter is referred to court. I thank you for your cooperation and look forward to your reply. Yours sincerely, Visual Rights Group Ltd, Company No. 11747843, Polhill Business Centre, London Road, Polhill, TN14 7AA, Registered Address: 42-44 Clarendon Road, Watford WD17 1JJ
Hi, It has come to our attention that you are using our client’s photographs on your site without a valid licence. We have already posted out all supporting documents to the address of your office. Please confirm once you have received them. In the meantime, we would like to invite you to settle this dispute by making the below payment of £500. Visual Rights Group Ltd, KBC Bank London, IBAN: GB39 KRED 1654 8703, 1135 11, Account Number: 03113511, Sort Code: 16-54-87 Once you have made the payment, please email us with your payment reference number. Please note that a failure to settle at this stage will only accrue greater costs once the matter is referred to court. I thank you for your cooperation and look forward to your reply. Yours sincerely, Visual Rights Group Ltd, Company No. 11747843, Polhill Business Centre, London Road, Polhill, TN14 7AA, Registered Address: 42-44 Clarendon Road, Watford WD17 1JJ
Hi, It has come to our attention that you are using our client’s photographs on your site without a valid licence. We have already posted out all supporting documents to the address of your office. Please confirm once you have received them. In the meantime, we would like to invite you to settle this dispute by making the below payment of £500. Visual Rights Group Ltd, KBC Bank London, IBAN: GB39 KRED 1654 8703, 1135 11, Account Number: 03113511, Sort Code: 16-54-87 Once you have made the payment, please email us with your payment reference number. Please note that a failure to settle at this stage will only accrue greater costs once the matter is referred to court. I thank you for your cooperation and look forward to your reply. Yours sincerely, Visual Rights Group Ltd, Company No. 11747843, Polhill Business Centre, London Road, Polhill, TN14 7AA, Registered Address: 42-44 Clarendon Road, Watford WD17 1JJ
Wow, great post.Really looking forward to read more. Much obliged.
Hi, It has come to our attention that you are using our client’s photographs on your site without a valid licence. We have already posted out all supporting documents to the address of your office. Please confirm once you have received them. In the meantime, we would like to invite you to settle this dispute by making the below payment of £500. Visual Rights Group Ltd, KBC Bank London, IBAN: GB39 KRED 1654 8703, 1135 11, Account Number: 03113511, Sort Code: 16-54-87 Once you have made the payment, please email us with your payment reference number. Please note that a failure to settle at this stage will only accrue greater costs once the matter is referred to court. I thank you for your cooperation and look forward to your reply. Yours sincerely, Visual Rights Group Ltd, Company No. 11747843, Polhill Business Centre, London Road, Polhill, TN14 7AA, Registered Address: 42-44 Clarendon Road, Watford WD17 1JJ
Great blog post.Much thanks again. Will read on…
Hi, It has come to our attention that you are using our client’s photographs on your site without a valid licence. We have already posted out all supporting documents to the address of your office. Please confirm once you have received them. In the meantime, we would like to invite you to settle this dispute by making the below payment of £500. Visual Rights Group Ltd, KBC Bank London, IBAN: GB39 KRED 1654 8703, 1135 11, Account Number: 03113511, Sort Code: 16-54-87 Once you have made the payment, please email us with your payment reference number. Please note that a failure to settle at this stage will only accrue greater costs once the matter is referred to court. I thank you for your cooperation and look forward to your reply. Yours sincerely, Visual Rights Group Ltd, Company No. 11747843, Polhill Business Centre, London Road, Polhill, TN14 7AA, Registered Address: 42-44 Clarendon Road, Watford WD17 1JJ
Hi, It has come to our attention that you are using our client’s photographs on your site without a valid licence. We have already posted out all supporting documents to the address of your office. Please confirm once you have received them. In the meantime, we would like to invite you to settle this dispute by making the below payment of £500. Visual Rights Group Ltd, KBC Bank London, IBAN: GB39 KRED 1654 8703, 1135 11, Account Number: 03113511, Sort Code: 16-54-87 Once you have made the payment, please email us with your payment reference number. Please note that a failure to settle at this stage will only accrue greater costs once the matter is referred to court. I thank you for your cooperation and look forward to your reply. Yours sincerely, Visual Rights Group Ltd, Company No. 11747843, Polhill Business Centre, London Road, Polhill, TN14 7AA, Registered Address: 42-44 Clarendon Road, Watford WD17 1JJ
Hi, It has come to our attention that you are using our client’s photographs on your site without a valid licence. We have already posted out all supporting documents to the address of your office. Please confirm once you have received them. In the meantime, we would like to invite you to settle this dispute by making the below payment of £500. Visual Rights Group Ltd, KBC Bank London, IBAN: GB39 KRED 1654 8703, 1135 11, Account Number: 03113511, Sort Code: 16-54-87 Once you have made the payment, please email us with your payment reference number. Please note that a failure to settle at this stage will only accrue greater costs once the matter is referred to court. I thank you for your cooperation and look forward to your reply. Yours sincerely, Visual Rights Group Ltd, Company No. 11747843, Polhill Business Centre, London Road, Polhill, TN14 7AA, Registered Address: 42-44 Clarendon Road, Watford WD17 1JJ
Im obliged for the blog article. Really Cool.
Hi, It has come to our attention that you are using our client’s photographs on your site without a valid licence. We have already posted out all supporting documents to the address of your office. Please confirm once you have received them. In the meantime, we would like to invite you to settle this dispute by making the below payment of £500. Visual Rights Group Ltd, KBC Bank London, IBAN: GB39 KRED 1654 8703, 1135 11, Account Number: 03113511, Sort Code: 16-54-87 Once you have made the payment, please email us with your payment reference number. Please note that a failure to settle at this stage will only accrue greater costs once the matter is referred to court. I thank you for your cooperation and look forward to your reply. Yours sincerely, Visual Rights Group Ltd, Company No. 11747843, Polhill Business Centre, London Road, Polhill, TN14 7AA, Registered Address: 42-44 Clarendon Road, Watford WD17 1JJ
Hi, It has come to our attention that you are using our client’s photographs on your site without a valid licence. We have already posted out all supporting documents to the address of your office. Please confirm once you have received them. In the meantime, we would like to invite you to settle this dispute by making the below payment of £500. Visual Rights Group Ltd, KBC Bank London, IBAN: GB39 KRED 1654 8703, 1135 11, Account Number: 03113511, Sort Code: 16-54-87 Once you have made the payment, please email us with your payment reference number. Please note that a failure to settle at this stage will only accrue greater costs once the matter is referred to court. I thank you for your cooperation and look forward to your reply. Yours sincerely, Visual Rights Group Ltd, Company No. 11747843, Polhill Business Centre, London Road, Polhill, TN14 7AA, Registered Address: 42-44 Clarendon Road, Watford WD17 1JJ
Hi, It has come to our attention that you are using our client’s photographs on your site without a valid licence. We have already posted out all supporting documents to the address of your office. Please confirm once you have received them. In the meantime, we would like to invite you to settle this dispute by making the below payment of £500. Visual Rights Group Ltd, KBC Bank London, IBAN: GB39 KRED 1654 8703, 1135 11, Account Number: 03113511, Sort Code: 16-54-87 Once you have made the payment, please email us with your payment reference number. Please note that a failure to settle at this stage will only accrue greater costs once the matter is referred to court. I thank you for your cooperation and look forward to your reply. Yours sincerely, Visual Rights Group Ltd, Company No. 11747843, Polhill Business Centre, London Road, Polhill, TN14 7AA, Registered Address: 42-44 Clarendon Road, Watford WD17 1JJ
Hi, It has come to our attention that you are using our client’s photographs on your site without a valid licence. We have already posted out all supporting documents to the address of your office. Please confirm once you have received them. In the meantime, we would like to invite you to settle this dispute by making the below payment of £500. Visual Rights Group Ltd, KBC Bank London, IBAN: GB39 KRED 1654 8703, 1135 11, Account Number: 03113511, Sort Code: 16-54-87 Once you have made the payment, please email us with your payment reference number. Please note that a failure to settle at this stage will only accrue greater costs once the matter is referred to court. I thank you for your cooperation and look forward to your reply. Yours sincerely, Visual Rights Group Ltd, Company No. 11747843, Polhill Business Centre, London Road, Polhill, TN14 7AA, Registered Address: 42-44 Clarendon Road, Watford WD17 1JJ
Hi, It has come to our attention that you are using our client’s photographs on your site without a valid licence. We have already posted out all supporting documents to the address of your office. Please confirm once you have received them. In the meantime, we would like to invite you to settle this dispute by making the below payment of £500. Visual Rights Group Ltd, KBC Bank London, IBAN: GB39 KRED 1654 8703, 1135 11, Account Number: 03113511, Sort Code: 16-54-87 Once you have made the payment, please email us with your payment reference number. Please note that a failure to settle at this stage will only accrue greater costs once the matter is referred to court. I thank you for your cooperation and look forward to your reply. Yours sincerely, Visual Rights Group Ltd, Company No. 11747843, Polhill Business Centre, London Road, Polhill, TN14 7AA, Registered Address: 42-44 Clarendon Road, Watford WD17 1JJ
Im grateful for the article post.Thanks Again. Really Cool.
Really enjoyed this blog post.Really thank you! Much obliged.
Hi, It has come to our attention that you are using our client’s photographs on your site without a valid licence. We have already posted out all supporting documents to the address of your office. Please confirm once you have received them. In the meantime, we would like to invite you to settle this dispute by making the below payment of £500. Visual Rights Group Ltd, KBC Bank London, IBAN: GB39 KRED 1654 8703, 1135 11, Account Number: 03113511, Sort Code: 16-54-87 Once you have made the payment, please email us with your payment reference number. Please note that a failure to settle at this stage will only accrue greater costs once the matter is referred to court. I thank you for your cooperation and look forward to your reply. Yours sincerely, Visual Rights Group Ltd, Company No. 11747843, Polhill Business Centre, London Road, Polhill, TN14 7AA, Registered Address: 42-44 Clarendon Road, Watford WD17 1JJ
Hi, It has come to our attention that you are using our client’s photographs on your site without a valid licence. We have already posted out all supporting documents to the address of your office. Please confirm once you have received them. In the meantime, we would like to invite you to settle this dispute by making the below payment of £500. Visual Rights Group Ltd, KBC Bank London, IBAN: GB39 KRED 1654 8703, 1135 11, Account Number: 03113511, Sort Code: 16-54-87 Once you have made the payment, please email us with your payment reference number. Please note that a failure to settle at this stage will only accrue greater costs once the matter is referred to court. I thank you for your cooperation and look forward to your reply. Yours sincerely, Visual Rights Group Ltd, Company No. 11747843, Polhill Business Centre, London Road, Polhill, TN14 7AA, Registered Address: 42-44 Clarendon Road, Watford WD17 1JJ
Really appreciate you sharing this blog. Awesome.
Hi, It has come to our attention that you are using our client’s photographs on your site without a valid licence. We have already posted out all supporting documents to the address of your office. Please confirm once you have received them. In the meantime, we would like to invite you to settle this dispute by making the below payment of £500. Visual Rights Group Ltd, KBC Bank London, IBAN: GB39 KRED 1654 8703, 1135 11, Account Number: 03113511, Sort Code: 16-54-87 Once you have made the payment, please email us with your payment reference number. Please note that a failure to settle at this stage will only accrue greater costs once the matter is referred to court. I thank you for your cooperation and look forward to your reply. Yours sincerely, Visual Rights Group Ltd, Company No. 11747843, Polhill Business Centre, London Road, Polhill, TN14 7AA, Registered Address: 42-44 Clarendon Road, Watford WD17 1JJ
Hi, It has come to our attention that you are using our client’s photographs on your site without a valid licence. We have already posted out all supporting documents to the address of your office. Please confirm once you have received them. In the meantime, we would like to invite you to settle this dispute by making the below payment of £500. Visual Rights Group Ltd, KBC Bank London, IBAN: GB39 KRED 1654 8703, 1135 11, Account Number: 03113511, Sort Code: 16-54-87 Once you have made the payment, please email us with your payment reference number. Please note that a failure to settle at this stage will only accrue greater costs once the matter is referred to court. I thank you for your cooperation and look forward to your reply. Yours sincerely, Visual Rights Group Ltd, Company No. 11747843, Polhill Business Centre, London Road, Polhill, TN14 7AA, Registered Address: 42-44 Clarendon Road, Watford WD17 1JJ
Hi, It has come to our attention that you are using our client’s photographs on your site without a valid licence. We have already posted out all supporting documents to the address of your office. Please confirm once you have received them. In the meantime, we would like to invite you to settle this dispute by making the below payment of £500. Visual Rights Group Ltd, KBC Bank London, IBAN: GB39 KRED 1654 8703, 1135 11, Account Number: 03113511, Sort Code: 16-54-87 Once you have made the payment, please email us with your payment reference number. Please note that a failure to settle at this stage will only accrue greater costs once the matter is referred to court. I thank you for your cooperation and look forward to your reply. Yours sincerely, Visual Rights Group Ltd, Company No. 11747843, Polhill Business Centre, London Road, Polhill, TN14 7AA, Registered Address: 42-44 Clarendon Road, Watford WD17 1JJ
Fantastic blog article.Thanks Again. Fantastic.
Hi, It has come to our attention that you are using our client’s photographs on your site without a valid licence. We have already posted out all supporting documents to the address of your office. Please confirm once you have received them. In the meantime, we would like to invite you to settle this dispute by making the below payment of £500. Visual Rights Group Ltd, KBC Bank London, IBAN: GB39 KRED 1654 8703, 1135 11, Account Number: 03113511, Sort Code: 16-54-87 Once you have made the payment, please email us with your payment reference number. Please note that a failure to settle at this stage will only accrue greater costs once the matter is referred to court. I thank you for your cooperation and look forward to your reply. Yours sincerely, Visual Rights Group Ltd, Company No. 11747843, Polhill Business Centre, London Road, Polhill, TN14 7AA, Registered Address: 42-44 Clarendon Road, Watford WD17 1JJ
Hi, It has come to our attention that you are using our client’s photographs on your site without a valid licence. We have already posted out all supporting documents to the address of your office. Please confirm once you have received them. In the meantime, we would like to invite you to settle this dispute by making the below payment of £500. Visual Rights Group Ltd, KBC Bank London, IBAN: GB39 KRED 1654 8703, 1135 11, Account Number: 03113511, Sort Code: 16-54-87 Once you have made the payment, please email us with your payment reference number. Please note that a failure to settle at this stage will only accrue greater costs once the matter is referred to court. I thank you for your cooperation and look forward to your reply. Yours sincerely, Visual Rights Group Ltd, Company No. 11747843, Polhill Business Centre, London Road, Polhill, TN14 7AA, Registered Address: 42-44 Clarendon Road, Watford WD17 1JJ
Hi, It has come to our attention that you are using our client’s photographs on your site without a valid licence. We have already posted out all supporting documents to the address of your office. Please confirm once you have received them. In the meantime, we would like to invite you to settle this dispute by making the below payment of £500. Visual Rights Group Ltd, KBC Bank London, IBAN: GB39 KRED 1654 8703, 1135 11, Account Number: 03113511, Sort Code: 16-54-87 Once you have made the payment, please email us with your payment reference number. Please note that a failure to settle at this stage will only accrue greater costs once the matter is referred to court. I thank you for your cooperation and look forward to your reply. Yours sincerely, Visual Rights Group Ltd, Company No. 11747843, Polhill Business Centre, London Road, Polhill, TN14 7AA, Registered Address: 42-44 Clarendon Road, Watford WD17 1JJ
A big thank you for your article post.Much thanks again. Keep writing.
Hi, It has come to our attention that you are using our client’s photographs on your site without a valid licence. We have already posted out all supporting documents to the address of your office. Please confirm once you have received them. In the meantime, we would like to invite you to settle this dispute by making the below payment of £500. Visual Rights Group Ltd, KBC Bank London, IBAN: GB39 KRED 1654 8703, 1135 11, Account Number: 03113511, Sort Code: 16-54-87 Once you have made the payment, please email us with your payment reference number. Please note that a failure to settle at this stage will only accrue greater costs once the matter is referred to court. I thank you for your cooperation and look forward to your reply. Yours sincerely, Visual Rights Group Ltd, Company No. 11747843, Polhill Business Centre, London Road, Polhill, TN14 7AA, Registered Address: 42-44 Clarendon Road, Watford WD17 1JJ
Hi, It has come to our attention that you are using our client’s photographs on your site without a valid licence. We have already posted out all supporting documents to the address of your office. Please confirm once you have received them. In the meantime, we would like to invite you to settle this dispute by making the below payment of £500. Visual Rights Group Ltd, KBC Bank London, IBAN: GB39 KRED 1654 8703, 1135 11, Account Number: 03113511, Sort Code: 16-54-87 Once you have made the payment, please email us with your payment reference number. Please note that a failure to settle at this stage will only accrue greater costs once the matter is referred to court. I thank you for your cooperation and look forward to your reply. Yours sincerely, Visual Rights Group Ltd, Company No. 11747843, Polhill Business Centre, London Road, Polhill, TN14 7AA, Registered Address: 42-44 Clarendon Road, Watford WD17 1JJ
Hi, It has come to our attention that you are using our client’s photographs on your site without a valid licence. We have already posted out all supporting documents to the address of your office. Please confirm once you have received them. In the meantime, we would like to invite you to settle this dispute by making the below payment of £500. Visual Rights Group Ltd, KBC Bank London, IBAN: GB39 KRED 1654 8703, 1135 11, Account Number: 03113511, Sort Code: 16-54-87 Once you have made the payment, please email us with your payment reference number. Please note that a failure to settle at this stage will only accrue greater costs once the matter is referred to court. I thank you for your cooperation and look forward to your reply. Yours sincerely, Visual Rights Group Ltd, Company No. 11747843, Polhill Business Centre, London Road, Polhill, TN14 7AA, Registered Address: 42-44 Clarendon Road, Watford WD17 1JJ
Very neat article post.Much thanks again. Want more.
Thank you for your post. Want more.
Im thankful for the post.Really looking forward to read more. Awesome.
Major thanks for the blog post.Really thank you! Really Cool.
Thanks a lot for the article post.Really looking forward to read more. Keep writing.
Say, you got a nice post.Thanks Again. Fantastic.
Im obliged for the post.Really thank you! Great.
Thanks again for the article.Much thanks again. Awesome.
Major thankies for the blog post.Thanks Again.
Really informative article.Thanks Again. Cool.
Thanks-a-mundo for the blog article.Really thank you! Really Cool.
Thank you for your blog post. Great.
Major thankies for the article.Thanks Again. Really Cool.
Great, thanks for sharing this article.Really thank you! Much obliged.
Looking forward to reading more. Great post. Great.
Very informative blog.Really thank you! Really Cool.
Very neat post.Thanks Again. Great.
Thank you ever so for you post. Cool.
Major thanks for the blog article.Much thanks again.
Fantastic article post.Really thank you! Much obliged.
I appreciate you sharing this blog post.Really looking forward to read more. Keep writing.
Im thankful for the post.Really thank you! Really Cool.
Hey, thanks for the article.Much thanks again. Fantastic.
Really appreciate you sharing this blog article.Much thanks again. Cool.
Muchos Gracias for your article post.Really thank you!
Say, you got a nice post.Thanks Again. Keep writing.
Looking forward to reading more. Great blog.Really looking forward to read more. Awesome.
Very good post.Really looking forward to read more. Keep writing.