Based on yesterday’s close, Nasdaq clocked a 63rd record close for 2017 and overtook the previous 62 record closes for 1980! S&P500, Nasdaq and Dow registered their 25th record close for 2017 simultaneously, matching the record established in 1995.
On our local front, STI approaches a more than two year high. 2017 has not ended yet. For those investors who have not invested much, are they too late to the party? Are there still stocks with scope for potential upside?
Personally, I believe that there are two companies, namely Hatten Land (“Hatten”) and GSS Energy (“GSS”) with interesting charts and bear watching in the next few weeks.
1.Hatten
Since my recent technical write-up on Hatten dated 26 Sep 2017 (click HERE), Hatten continues to trade in a tight range $0.192 – 0.210 since 28 Jul 2017. Recently, there seems to be a pick up in the volume traded for the past two days with the volume traded for the last two days being the highest since 17 Aug 2017.
Based on Chart 1 below, Hatten’s chart looks positive on multiple fronts, namely:
a) Since 28 Jul 2017, there seems to be a pick-up in volume whenever Hatten approaches $0.210. This seems to signify accumulation. On the days which Hatten falls from $0.210 and approaches the lower end of the range $0.192 – 0.196, it is accompanied with lower than average volume;
b) Hatten may be forming a potential triple bottom formation with the neckline at $0.210. Indicators such as RSI, MFI and MACD have strengthened;
c) Notwithstanding Hatten’s sideways trading for the past three plus months, its OBV has been strengthening which may be indicative of smart money accumulating the stock. In fact, OBV closes near the highest since its RTO on 28 Feb 2017;
d) ADX has increased from 14.8 on 26 Sep 2017 to close at 47.3 on 3 Nov 2017. This is indicative of a trend. In other words, the likelihood of a successful breach above $0.210 is likely to be higher this time than Sep;
e) All the exponential moving averages (“EMAs”) have either stopped declining or have started to rise. In fact, 20D EMA has already turned higher.
Near term supports: $0.199 – 0.200 / 0.196 / 0.192
Near term resistances: $0.210 / 0.235 / 0.255 – 0.260
Chart 1: Poised for a breach above $0.210

Source: Chartnexus as of 3 Nov 17
Personal view: odds are higher this time that Hatten should breach $0.210 but…
My personal view on Hatten is that odds are higher this time that Hatten may breach $0.210. A sustained breach $0.210 with volume and on a sustained basis points to a first measured technical target of around $0.230. It may even head to the next resistance level of around $0.255 – 0.265. However, there are various noteworthy points to take note, such as:
a) Chart observation is usually subjective in nature;
b) Hatten is scheduled to release results in the next couple of weeks, likely to be this coming week. Depending on its results, this is likely to be a driver for its share price performance;
c) As I have pointed out in my comment in 联合早报 published last Fri morning, both large and small Singapore property developers have registered sharp gains this year. There may be rotational interest into Malaysia property developers listed on Singapore bourse which have not been in favour all this while.
d) A sustained break below $0.180 with volume is bearish for the chart.
2.GSS
Since my latest write-up on GSS dated 6 Oct 2017 (click HERE), GSS has risen 7.4% from $0.162 on 6 Oct 2017 to $0.174 on 3 Nov 2017.
GSS’ chart (see Chart 2 below) continues to look positive due to the following:
a) On 30 Oct 2017, GSS breached the long-term downtrend line established since 29 Mar 2017. 16.6m shares transacted on that day which is almost three times its average 30D volume. Since 30 Oct, GSS has held up relatively well and closed at $0.174 for the past three days;
b) ADX has started to rise from 22.0 on 27 Oct 2017 to close at 27.6 on 3 Nov 2017. This is indicative of a trending market;
c) 20D, 50D and 100D EMA are starting to pull apart after (almost) converging. This seems to indicate that the trend is strengthening;
d) Although GSS’ share price is not at a record high, OBV is at a record high level. This may indicate that smart money is flowing into the stock;
e) Other indicators are strengthening such as RSI and MACD. RSI closed at 66.0 on 3 Nov 2017. There have been many occasions where RSI has exceeded 70. The highest RSI reading over the past three years is 86.0. Thus, GSS is not overbought yet.
Near term supports: $0.172 / 0.167 / 0.164 – 0.165
Near term resistances: $0.181 – 0.182 / 0.188 / 0.198 – 0.200
Chart 2: Decisive breach of its downtrend line with volume expansion

Source: Chartnexus as of 3 Nov 17
Readers should be aware of the following points:
a) Like Hatten, the above chart observation for GSS is subjective. Furthermore, GSS’ upcoming 3QFY17F result (depending on whether it can meet, or exceed market expectations) to be released in the next couple of weeks, is likely to be a driver for its share price performance;
b) It is common knowledge that GSS is drilling for oil. Thus, there may be updates on GSS’ oil business division in the next few weeks (i.e. whether it manages to find oil etc). Such update is likely to be another driver for its share price performance. See Nextinsight’s detailed write-up on its oil foray (click HERE);
c) My personal feel is that GSS has lagged its technology counterparts both in terms of share price performance, as well as, valuation. With reference to Table 1, the sector is trading at an approximate 16x FY17F PE and 13x FY18F PE. Except for Fu Yu and GSS, the other stocks outlined in Table 1 below are (easily) trading at, or near their 10-year highs. GSS is still trading approximately 12% lower since its intra-day year to date high of around $0.198. I have previously written on GSS and how its engineering business is trading at lower valuation than its peers (click HERE).
Table 1: Tech plays trade at an average 16x FY17F PE and 13x FY18F PE
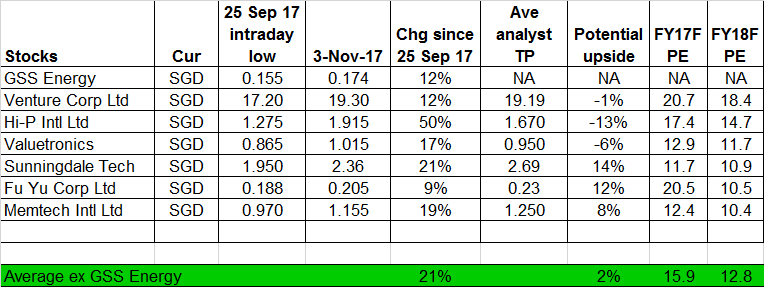
Source: Ernest’s compilations
d) GSS has also lagged the other small oil companies in terms of share price performance. Table 2 shows the share price performance of some of the smaller oil and gas stocks. Since 25 Sep 2017, GSS’ 12% share price appreciation pales the average 40% gain of the smaller oil and gas stocks. Some of these oil and gas stocks such as Mirach, Rex and RH Petrogas have also just breached above their 200D EMAs. Nevertheless, it can be argued that GSS is still not considered an oil play yet, as it has not produced any oil. However, should GSS start to produce oil, its valuation may arguably increase, in addition to the potential re-rating for its engineering business closer to its peers.
Table 2: Oil and gas stocks have rocketed an average 40% gain since 25 Sep 17
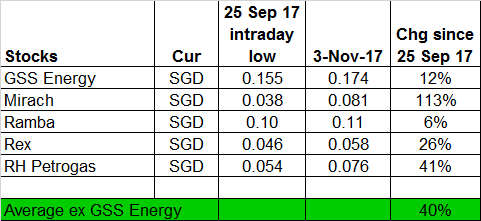
Source: Ernest’s compilations (There is no estimated PE as there is no analyst coverage for the stocks above)
e) A sustained breach below $0.165 with volume is negative for the chart.
Conclusion – Based on my personal chart observations
In a nutshell, the above write-up revolves around both Hatten’s and GSS’ charts as their charts have caught my attention. Based on my personal chart observations:
a) Hatten: Hatten may be forming a potential triple bottom formation with the neckline at $0.210. Indicators such as RSI, MFI, MACD and OBV have strengthened. If Hatten manages to breach $0.210 with volume and on a sustained basis, the first measured technical target is around $0.230. It may even head to the next resistance level of around $0.255 – 0.265;
b) GSS: GSS has breached a multi month downtrend line with volume expansion. This is bullish and there is likely scope for more upside. GSS should also benefit from a resurgence of both tech and oil and gas plays.
Lastly, both Hatten and GSS have specific factors (see above) to take note besides its charts. Readers should do their own due diligence and exercise their independent judgment.
P.S: I am vested in both Hatten and GSS.
Disclaimer
Please refer to the disclaimer HERE
Wow, wonderful weblog format! How lengthy have you ever been blogging for?
you made blogging look easy. The whole look of your web site is great, as well as the content material!
You can see similar here dobry sklep