Koda has dropped 43% from an intraday high of $1.095 on 31 Oct 2017 to close $0.625 on 16 Mar 2018.
Has Koda’s fundamentals deteriorate since Oct 2017 to warrant such a massive price decline?
I have the privilege of meeting Mr Joshua Koh, CEO of Commune Lifestyle Pte Ltd (“Management”) for a 1-1 discussion over Koda / Commune’s operations and prospects.
Koda’s & Commune’s background
Koda was established in 1972 by Mr Koh Teng Kwee. It started by producing wooden TV and speaker cabinets. Since its inception, Koda has progressed from being an Original Equipment Manufacturer (OEM) to an Original Design Manufacturer (ODM). Its forte is in home furniture and it is possibly the largest dining room furniture exporter in Southeast Asia.
Besides its ODM business, Koda established Commune Lifestyle Pte Ltd in 2011. This is their in-house brand and managed by the 3rd generation of the founding Koh family. Commune has presence in Singapore, Malaysia, China and Australia and is currently their largest growth driver. Readers can refer to the respective websites for more information on Koda (click HERE) and Commune (click HERE).
Koda has been listed on SGX since 18 Jan 2002.
Investment merits
Attractive valuations
Based on Table 1 below and on an annualised basis, Koda trades at 8.2x FY18F PE at the current price of $0.625.
Table 1: Koda’s 1HFY18 results at a glance
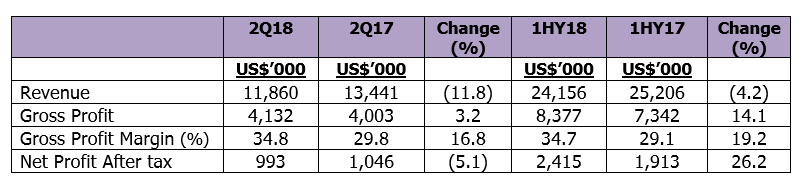
Source: Company
The above is noteworthy on two fronts:
-
2QFY18 results were impacted by timing differences. Shipments to key export markets ordered in December were mostly shipped in early January. Thus, 2QFY18 results should have been stronger;
-
Based on its 2QFY18 results, Koda is sitting on a net cash amounting to US$7.4m. On an ex-cash basis, Koda trades at 6.7x FY18F PE.
Just for illustration purposes with some companies in the furniture space, in HTL International’s take-over offer in early 2016, it was offered 11x based on their profit guarantee in Year 1 (click HERE). Man Wah which delisted in Singapore in Sep 2009 and listed on HK Stock Exchange on Apr 2010 is trading at 16.1x estimated earnings based on Bloomberg’s figures.
Notwithstanding the above, both HTL International and Man Wah are larger than Koda and are not exactly “apples-to-apples” comparisons.
China growth story
From the current 43 distributor-retail (“DR”) stores in China, Commune is set to more than double its presence by expanding to 100 stores by June 2020. Koda believes that China holds great potential as it is common knowledge that the Chinese government is shifting export led growth to an economy focused on domestic consumption. In addition, Koda believes that its Commune brand is perceived by the Chinese consumers as avant-garde. This is because their stores are distinctively black, yet they offer a range of contemporary furniture that suits a wide audience of consumers.
In addition, to deepen and expedite its expansion into China, Koda may have possible strategic collaboration with other local industry players.
Expanding into China, but not ignoring the rest of Asia
In a joint announcement with IE Singapore on 13 Feb 2018, it was reported that IE Singapore will work with Commune to expand into Taiwan, Indonesia and Thailand. Besides having expansion plans Taiwan, Indonesia and Thailand, Koda may plan to expand their Commune brand into Philippines too. Based on Koda’s 2QFY18 results, it was reported that Koda may start to have Commune presence in new markets within Asia over the course of 2018.
Besides helping Commune to expand, IE Singapore will also support the development of a digital platform to complement Commune’s physical presence.
Net cash company with dividends
Koda has only US$0.88m in debt as of Dec 2017. It has cash and cash equivalents amounting to US$8.26m. I.e. This is a net cash company. For the past three years, it has also been giving out dividends (See Table 2 below). However, it is noteworthy that although Koda distributed SG 3.5 cents in FY17, this dividend per share is slated to drop as Koda has done two bonus issues in CY2017.
Table 2: Koda’s dividend record for the past three calendar years
![]()
Source: Shareinvestor
ODM business is not going away
According to management, Koda’s ODM business is still growing. U.S., Koda’s largest export market continues to be buoyed by good GDP data, job creation and wage growth. U.S. housing sector continues to be resilient too which should bode well for Koda’s ODM business.
Production capacity can increase with limited capex
Inclusive of their recent acquisition of land buildings in Vietnam in Oct 2017, average utilisation rate is around 70-80%. (Optimal utilisation rate is around 85-90%). However, management emphasises that this 70-80% utilisation rate is based on one shift alone. If they expand to 1.5 – 2 shifts, they can have a significant increase in their capacity without much capex.
Furthermore, Koda is buying new equipment (i.e. CNC machines) with the aim of improving productivity and managing the rising cost of labour. Such investments in new equipment are unlikely to exceed US$1m per year.
1st share buyback since Sep 2016
Koda started its first share buyback since Sep 2016 by buying 2,000 shares at $0.640 on 12 Mar 2018. Although this is a small quantity limited by Koda’s lack of liquidity, this is still a positive signal that management feels the company is under-valued. It is noted that share buyback on the market transaction is limited to 105% of the average closing price over the last five trading days. Let’s monitor and see whether the buy backs will continue.
Succession planning
Several SGX listed family-owned listed companies do not have a clear succession plan. It is assuring that the 3rd generation of Koh family has the passion and willing to continue the older Kohs’ business.
Transformation bears fruit with best net profit posted in the past eight years
Since Commune was started in 2011, coupled with streamlining of its operations (such as consolidating production facilities in Vietnam and relocating factories out of China) and disposing loss making retail business (Rossano) in Vietnam etc. Koda has posted encouraging results since 2016. Table 3 below shows the rising net profit and margins since 2015. In fact, FY17 net profit of US$4.1m was the best profit in the past eight years. If Koda can replicate its 1HFY18 net profit of US$2.4m to 2HFY18F, it will be another record year in the past nine years.
Table 3: Koda’s results for the past five years
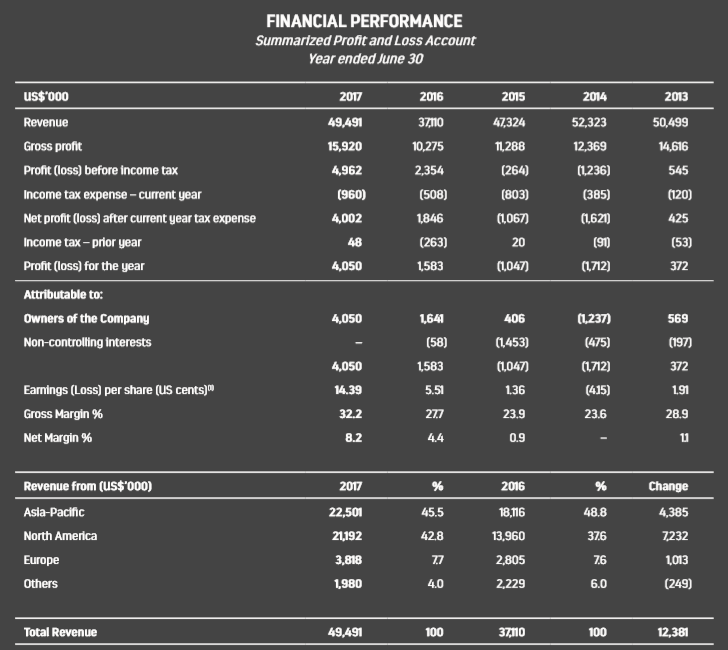
Source: Company
Investment risks
Some noteworthy investment risks are as follows:
Demise of the retail channel
There have been concerns that e-commerce platforms will / have rendered brick and mortar shops obsolete. Management is aware of such challenges and have put in some interesting and useful retail technologies such as virtual reality (“VR”) simulation, coupled with 3D floor planner at their Commune stores. This even caught the attention of Sim Ann, Senior Minister of State at the ministries of Culture, Community and Youth and Trade and Industry who quoted Commune in her speech at the Retail Center of Excellence on 10 Oct 2017 (Click HERE for her speech).
Illiquid with daily average 30D volume amounting to 37K shares
Notwithstanding the two bonus shares issuance last year, Koda’s shares are thinly traded. Average 30D and 100D volume amount to 37K shares and 76K shares respectively. This is not a liquid company where investors with meaningful positions can enter or exit quickly.
Lease expiry end of this year?
Based on Koda’s FY17 annual report, Koda’s head office and warehouse at 28 Defu Lane 4 has a lease expiry at end 2018. Management clarified that they still have 1-2 years after end 2018 to negotiate the lease and to assess their options.
No rated analyst coverage
During 2007 – 2008, Koda was covered by a few brokerage houses, namely OCBC, Maybank and RHB. However, Koda’s results weakened after the global financial crisis in 2009-2009 and analysts gradually dropped coverage. As of now, there is no rated analyst coverage on Koda. Notwithstanding Koda’s long operating history, it is likely that some investors and fund managers are still not familiar with Koda’s business and prospects, thus it may take some time for Mr. Market to get to know this company.
Possible execution risks in overseas expansion
Koda currently has 43 DR stores in China spanning Beijing, Shanghai, Nanjing, Tianjin etc. They have plans to expand to 100 stores in China and at least eight stores in other parts of Asia by June 2020. In view of their aggressive expansion, there may be possible execution risks. However, management seems confident that they should be able to execute their carefully planned expansion targets without significant hiccups.
Small market cap of S$51m
Koda is a small company with an approximate market capitalisation of S$51m. With its small market capitalisation and illiquid nature, it may be difficult to attract analysts and fund managers’ attention.
Trade tariffs
If the global countries engage in destructive and stiff trade tariffs, Koda will be affected too, together with its other peers.
P.S: Do note the above list of risks is not exhaustive
Chart analysis
Based on Chart 1 below, Koda has slumped 43% after hitting a high of $1.095 on 31 Oct 2017. This may be attributed partly to the two rounds of bonus issues in less than a year. Koda is entrenched in a downtrend with all the exponential moving averages (EMAs) moving lower, coupled with death cross formations. Amid negatively placed directional indicators, ADX has risen from 18.8 on 5 Feb 2018 to close 48.7 on 16 Mar 2018. This indicates that the downtrend is quite strong. Notwithstanding the bearish chart, it is assuring that the breakdown at its 200D EMA of around $0.655 is not accompanied with larger than expected volume. In fact, volume has largely decreased since 1 Mar 2018. In addition, indicators such as RSI are exhibiting bullish divergences. This may indicate that the downtrend is weakening in momentum but may not mean that an impending rebound is on the way. It is noteworthy that a sustained breach above $0.655 alleviates the strong bearish feel of the chart. Only a sustained breach above $0.765 negates the bearish feel of the chart.
Near term supports: $0.615 / 0.600 – 0.605 / 0.570
Near term resistances: $0.655 / 0.700 / 0.725
Chart 1: Koda slumps 43% since hitting a high of $1.095 on 31 Oct 2017

Source: Chartnexus 16 Mar 2018
P.S: Chart reading is subjective especially for illiquid stocks.
In a nutshell,
Koda has slumped 43% from an intraday high of $1.095 on 31 Oct 2017 to close $0.625 on 16 Mar 2018. If company can continue to execute its plan of expanding to China and other parts of Asia, and delivers on its results, the current (low) price may be an opportunity for investors, who believe in Koda’s management and prospects to start taking a closer look into the company.
Notwithstanding the above, readers should be aware of some of the potential risks in Koda (the list of risks is by no means exhaustive). It is important to do your due diligence before making any trading or investment decision. Readers who have questions on Koda can contact their investor relation firm WeR1 (contacts on Koda’s press release) for more information. Readers can also consider visiting Commune’s stores (click HERE for the stores’ location)
P.S: I am currently vested. However, please note that as I am a full time remisier, I can change my position fast to capitalise on the markets’ movements.
Disclaimer
Please refer to the disclaimer HERE
always i used to read smaller posts which as well clear their motive, and that is also happening with this paragraph which I am reading here.
I’ve been browsing online more than 4 hours today, yet I never found
any interesting article like yours. It is pretty worth
enough for me. In my view, if all site owners and bloggers made good content as
you did, the net will be a lot more useful than ever before.