Dear all,
S&P500, Nasdaq and Russell 2000 hit records last Friday with S&P500 closing at 2,875. However, our STI has dropped 11.8% after hitting a decade high of 3,642 on 2 May 2018. Hang Seng has also tumbled 17.4% after hitting a high of 33,484 on 29 Jan 2018.
Is this the time to switch out of the U.S. markets and plough it back to STI and Hang Seng? This seems to be the question on most investors’ minds as I am also posed this question during a live interview on Money FM89.3 on last Thursday.
Let’s take a closer look at the charts and my personal action plan.
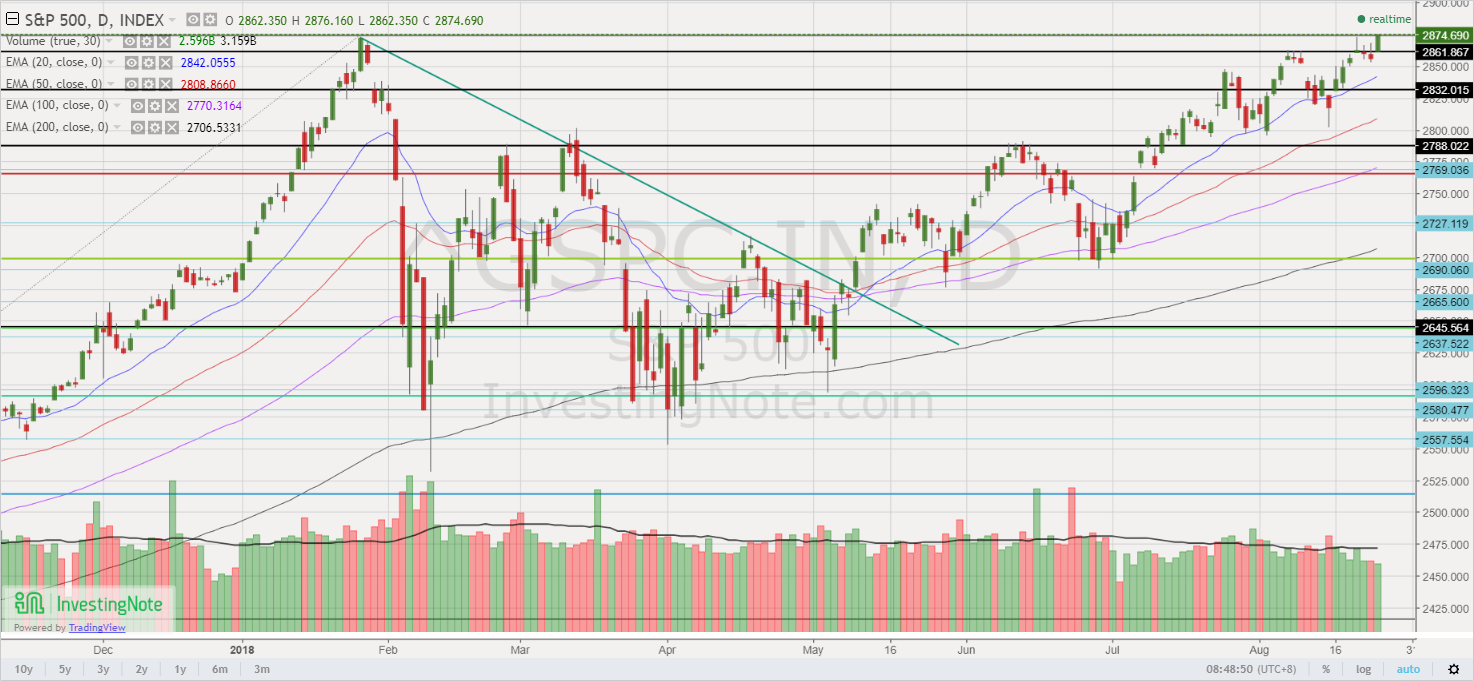
S&P500 closes 2,875. Day range 2,862 – 2,876
Based on Chart 1 below, All the exponential moving averages (“EMAs”) are moving higher with golden cross formations. ADX is still low around 10.0, amid positively placed directional indicators (“DIs”). With the low ADX, it is indicative of a sideways trading market. If I use the reference points 26 Jan 2018, 21 Aug 2018 vs 24 Aug 2018, MACD, MFI and RSI and OBV have exhibited somewhat bearish divergences. RSI closes 63.9 on 24 Aug 2018.
Near term supports: 2,862 / 2,853 / 2,842 / 2,809 / 2,800
Near term resistances: 2,900 / 2,925 / 2,950
Personal view: Given the weak ADX and bearish divergences, it is unlikely that S&P500 can breach 2,875 on a sustained basis. Any potential upside is likely to be limited around 2,875 – 2,900 in the near term. A sustained break below 2,800 will be the 1st negative for the chart.
Chart 1: S&P500 – unlikely to stage a sustained breach above 2,875 – 2,900
Source: InvestingNote 24 Aug 2018
Hang Seng closes 27,672. Day range 27,532- 27,831
Based on Chart 2 below, Hang Seng broke below the Feb 2018 – Jun 2018 trading range 29,454 – 31,810, pointing to an eventual measured technical target 27,098. If I use the one-month trading range 28,000 – 28,960, this will also point to an eventual technical measured target 27,040. These targets have already been attained. Hang Seng has closed at two low points on 3 Aug 2018 (27,676) and 16 Aug 2018 (27,100). Except for MFI, none of the indicators is exhibiting bullish divergences, suggesting that the recent decline may not be over yet.
All EMAs are declining with death cross formations. Amid negative DI reading, ADX closes 24.0 on 24 Aug 2018, indicative of a trend. RSI closes 43.3 on 24 Aug 18.
Near term supports: 27,516 – 27,568 / 27,200 / 27,040 -27,098 / 26,845 / 26,638
Near term resistances: 27,914 / 28,093 / 28,457 – 28,504 / 28,960 / 29,116 – 29,127
Personal view: With the two trading ranges above, I derive a measured technical target 27,040 – 27,098 which has been attained. Indicators have not shown much bullish divergences. Coupled with >20 ADX (negatively placed DI), Hang Seng may continue to be weak and the decline may not be over yet. A sustained breach above 29,127 should negate the bearish feel in the chart.
Chart 2: Hang Seng – recent decline may not be over yet

Source: InvestingNote 24 Aug 2018
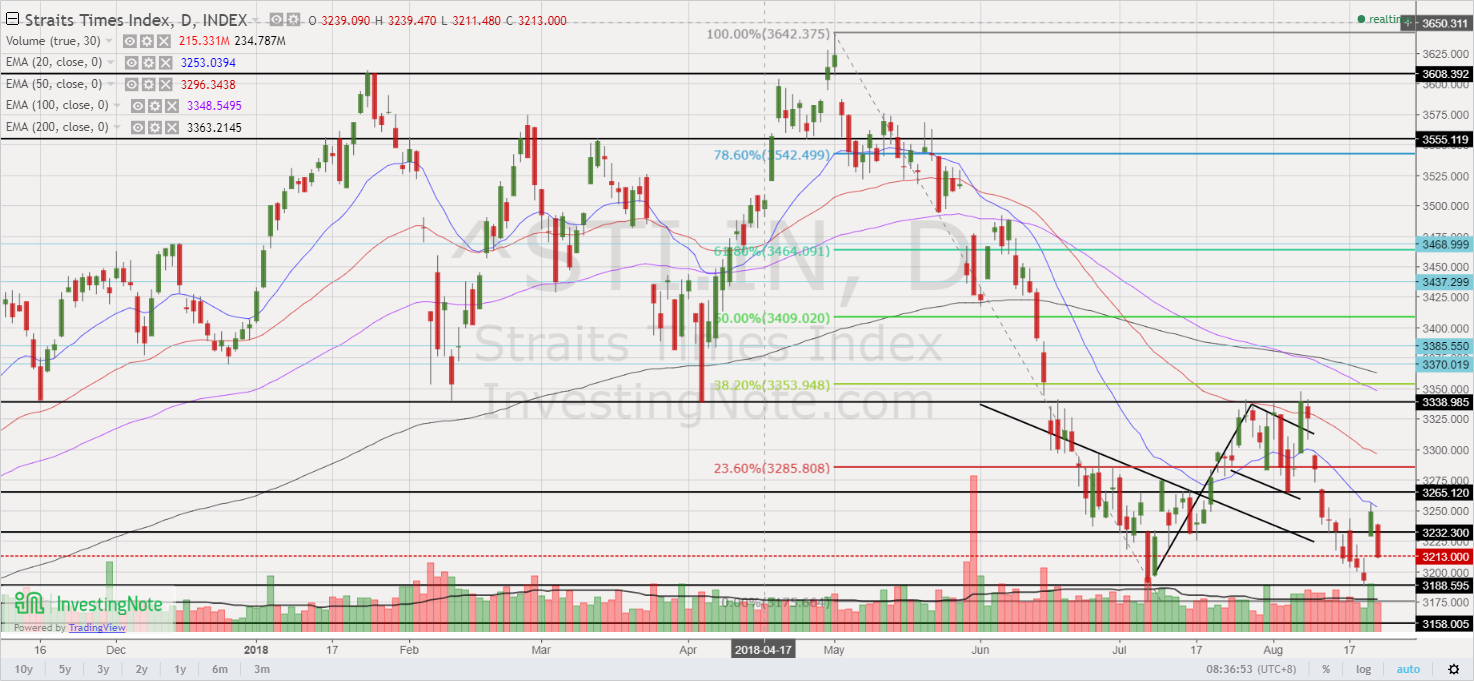
STI closes 3,213. Day range 3,211 – 3,239
Based on Chart 3 below, STI has broken its 200D EMA and more noteworthy, the 3,340 support tested on 16 Nov 2017, 9 Feb 2018 and 4 Apr 2018. It has also broken Oct 2017 – Jun 2018 trading range 3,340 – 3,608, with an eventual technical measured target 3,072. It has tried to test the resistance 3,340 on 19 Jun and 26 Jul – 8 Aug 2018 but has fallen back after testing. STI closes at 3,213 on 24 Aug 18.
Amid negatively placed DIs, ADX closes at 22.6 on 24 Aug 2018, indicative of a trend. All EMAs are falling with death cross formations. Indicators are mixed at this point. RSI closes at 40.9 on 24 Aug 2018.
Near term supports: 3,200 / 3,190 / 3,176 / 3,136
Near term resistances: 3,253 / 3,265 / 3,286 / 3,296 – 3,300 / 3,340
Personal view: Overall, STI chart looks bearish. In the near term, it is likely that STI should find good support 3,190 – 3,200 (tested multiple times on May 2017, Jun 2017, Jul 2017, Sep 2017, Jul 2018, Aug 2018 and strong resistance 3,300 & 3,340. However, it is more likely to test the downside than the upside based on my above chart interpretation.
Chart 3: STI looks bearish, more likely to test downside than upside
Source: InvestingNote 24 Aug 2018
FSTS closes 365.0. Day range 364.5 – 366.1
Based on Chart 4 below, FSTS hit another multi-year low on 21 Aug 2018 but closes off the low at 365.0 on 24 Aug 2018. Chart is entrenched in a strong downtrend since Jan 2018 with downward sloping EMAs (except for 20D EMA which is tapering) and death cross formations. ADX closes 24.9, amid negatively placed Dis. RSI closes 44.8 on 24 Aug 2018.
Near term supports: 364 / 361 / 355 / 350
Near term resistances: 366 / 368 – 369 / 374 / 376
Personal view: There is a good chance that FSTS may have less downside (than STI should the markets fall) in the near-term as some indicators are already exhibiting bullish divergences.
Chart 4: FSTS – closes at another multi-year low on 21 Aug 2018

Source: InvestingNote 24 Aug 2018
Conclusion
Notwithstanding the soaring U.S. indices, our Asian indices continue to be lacklustre. Generally speaking, if I have U.S. stocks, I am likely to take profit or cash out, given that they may only have limited potential upside in the near-term. Will I enter STI or / and Hang Seng given their underperformance? My personal take (I am be wrong) is that I will be cautious in the next one to two months due in part to the below factors:
a) As we approach Sep, U.S. markets may start to price the likelihood of a Democratic party takeover of at least one chamber of the U.S. Congress in the midterm elections on 6 November. This may lead to political uncertainty and perhaps more investigations into possible abuses by the Trump administration;
b) There may be more political drama as details and developments continue to unravel around people connected to President Trump. For example, his campaign chairman Paul Manafort was charged on eight charges including bank and tax fraud. Michael Cohen, Trump’s former lawyer admitted that he violated campaign-finance law.
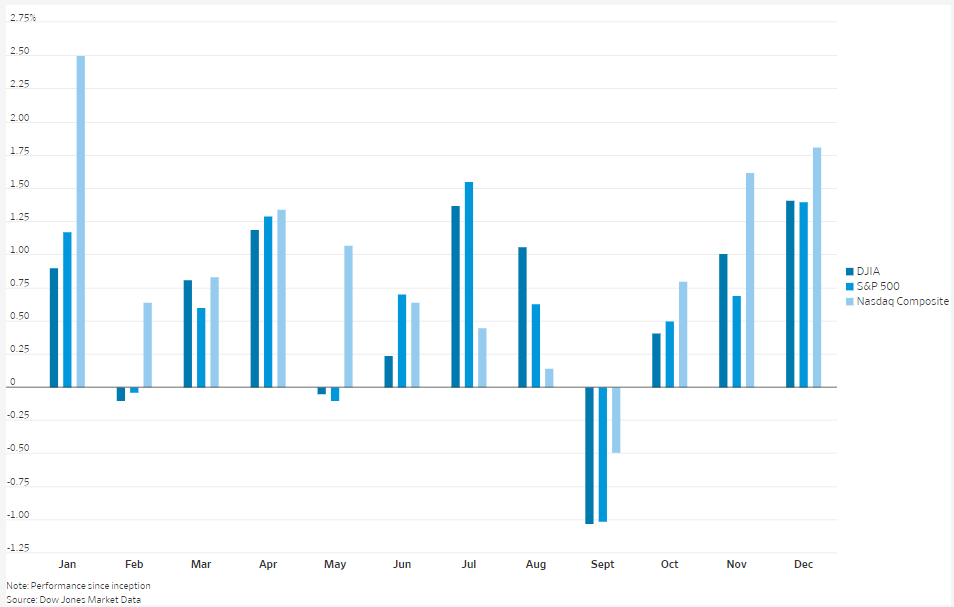
c) Based on Chart 5 below, Sep has usually been the worst month for the U.S. market. According to data compiled by Dow Jones Data Group, S&P500 posted an average return of -1.0% for 55% of the time;
Chart 5: U.S. indices’ monthly performance since 1928
d) Headline news on trade tensions will continue to influence market be it U.S. vs China, or U.S vs other countries such as EU. Some market watchers suspect that U.S. may continue to raise pressure on China on trade tariffs ahead of mid-term election. Others expect China may not want to seriously talk to U.S. and wait after mid-term elections to negotiate;
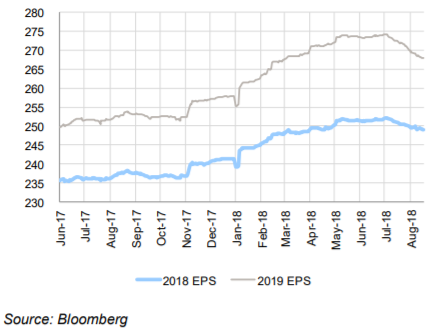
e) Singapore corporates have already announced their results and some blue chips such as banks and Singtel have already ex-dividend. i.e. There are limited catalysts to hold on to too many stocks in the near-term. Importantly after our 2Q results, some analysts have cut earnings estimates for FY19F. This is because our banks have reported lower loan growth expectations and wealth management fees and our telcos have cited more intense competition and weaker regional currencies. Property companies are also cautious in their outlook hence this resulted in earnings cut for FY19F. Based on Chart 6 below, it is evident that the cut in STI’s FY19F EPS is more apparent post 2Q results;
Chart 6: STI’s EPS cut
f) Valuations are high by some measures such as price to sales or CAPE ratio. There is an article which cited S&P500 price to sales ratio is around the highs last seen in 2000 and if the author uses median price to sale, it is twice as high!
h) Based on Chart 7 below, the OECD composite leading indicator has been edging down in the past few months and is below the long-term average. This may arguably mean that growth in the OECD countries (e.g. Germany, France, Japan, UK, U.S.) may ease in the next 6-12 months with the likely exception of U.S.
Chart 7: OECD lead indicator has been sliding down and below the long-term average

Source: OECD
i) Last but not least, liquidity is likely to continue to tighten as Fed continues to raise rates; ECB may end its QE at the end of the year and some emerging economies may have no choice but to keep raising rates to protect their currencies.
P.S: Do note the above list of factors is not exhaustive and it is my own personal view. In short, there seems to be several headwinds in the near term. Nevertheless, I remain positive on the equity market over the medium term. However, I am just cautious in the next couple of months as I believe I may have a better entry level in the next couple of months.
In view of the above points which I have highlighted and my technical outlook on the charts, I have already started to sell into strength these few weeks and have reduced my % invested to below 50%. I may pare down to below 40% as I continue to take profit on positions which I have previously entered on results.
Below is my *trading plan for the next couple of months:
a) Plan to accumulate small mid cap stocks with potential near-term catalysts on weakness (e.g. if they reported poor (likely one off) results with unchanged positive long-term views etc). I have and will continue to share with my clients on my portfolio actions and some trading / investing ideas;
b) I may use CFD or cash to accumulate some blue-chip stocks either in Singapore, or Hong Kong on weakness;
c) I may take profit on some stocks (which I have entered on results’ expectations) when they release results;
d) I may switch out some of my stocks to enter other stocks, should other compelling opportunities arise.
*Naturally, my market outlook and trading plan are subject to change as charts develop. My plan will likely not be suitable to most people as everybody is different. I can easily raise to 150-200% invested with the use of CFDs. I do not know whether markets will definitely rebound, or continue to drop. However, I am acting according to my plans. In other words, my market outlook; portfolio management; actual actions are in-line with one other. Notwithstanding this, everybody is different hence readers / clients should exercise their independent judgement and carefully consider their percentage invested, returns expectation, risk profile, current market developments, personal market outlook etc. and make their own independent decisions.
Readers who wish to be notified of my write-ups and / or informative emails, can consider signing up at http://ernest15percent.com. However, this reader’s mailing list has a one or two-day lag time as I will (naturally) send information (more information, more emails with more details) to my clients first. For readers who wish to enquire on being my client, they can consider leaving their contacts here http://ernest15percent.com/index.php/about-me/
P.S: Do note that as I am a full time remisier, I can change my trading plan fast to capitalize on the markets’ movements.
Disclaimer
Please refer to the disclaimer HERE
Wow, incredible weblog structure! How long have
you ever been running a blog for? you made running a blog
glance easy. The total look of your website is wonderful, let
alone the content! You can see similar here najlepszy sklep