This week, Frencken has caught my attention with its 34% surge from $0.690 on 31 Oct 2019. It closed $0.925 on 19 Nov 2019. At $0.925, this is very near to its 10-year high closing price $0.930 set on 18 Nov 2019. Since 31 Oct 2019, it has risen 10 out of the past 13 trading days with two days having closed unchanged. RSI closed at 88.1 on 19 Nov 2019, which is near a 14 year overbought level.
Based on Frencken’s chart, it seems to present a favourable risk to reward short trade. Please see the basis and more importantly, the risks.
Basis
A) Analytical, automotive and industrial automation segment to slow in 4QFY19, on y/y basis
According to Frencken’s 3QFY19 results, its analytical and automotive segments are likely to see a year on year decline in topline for 4QFY19 results. More importantly, Frencken’s industrial automation segment (largest business segment by revenue in 9MFY19) may register a year on year and quarter on quarter decline in revenue in 4QFY19.
B) Chart is overbought
Based on Chart 1 below, it is evident that Frencken is overbought with its almost uninterrupted meteoric rally in a relatively short span of time. Since 31 Oct 2019, it has risen 10 out of the past 13 trading days with two days closing unchanged, clocking in a 34% rally. RSI closed at an overbought level of 88.1 on 19 Nov 2019. Since May 2005, there were only three occasions where RSI is higher than 88.1 with the highest level 90.2 set on 18 Nov 2019. Furthermore, other indicators are also near, or at all time overbought levels. For example, MACD is already at an all-time high. MFI is also near the highest at around 95.7 (highest possible is 100).
Near term supports: $0.910 / 0.875 – 0.880 / 0.850
Near term resistances: $0.945 – 0.950 / 0.960 / 0.975
Chart 1: Frencken closed near 10-year high price, amid 14-year overbought level

InvestingNote 19 Nov 2019
C) Frencken has risen most against its peers since 31 Oct
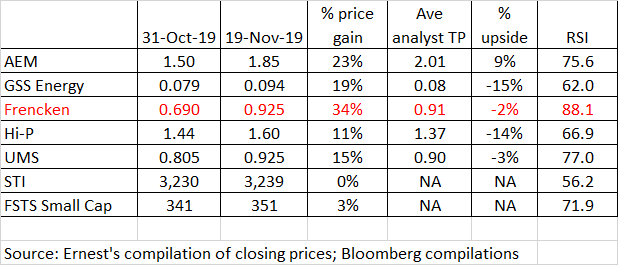
Based on Table 1 below, Frencken has risen the most (34%) since 31 Oct and it is the most overbought (RSI: 88.1) among the stocks in Table 1. To be fair, it depends on when my reference point is. For example, if I were to use 3 Oct closing price as my reference point, AEM will have easily surpassed Frencken in terms of share price performance. Suffice to say that there are three points which I want to get across via Table 1. Firstly, technology stocks have run quite a fair bit with average share price gain of about 20% as compared to FSTS 3% gain over the same period. Secondly, at this point in time, Frencken is the most overbought stock and has run the most since 31 Oct. Thirdly, most technology stocks highlighted in Table 1 (with the exception of AEM), are currently trading above average analyst target prices.
Table 1: Stock price performance for some tech stocks
D) Limited potential upside
Average analyst target ranges from $0.82 – $0.95 with consensus target at $0.910. i.e. It is above analyst target price. KGI just downgraded Frencken to a hold call on last Monday. If the analysts are correct, it may indicate limited potential capital upside for Frencken, at least in the near term.
Figure 1: Average analyst target price $0.910
Source: Bloomberg 19 Nov 2019
E) Trading above 5-year average valuations
Frencken, besides trading above average analyst target price, is also trading above its 5-year valuations. Frencken’s current PE and P/BV are 9.4x and 1.4x respectively. These levels are above its 5-year average PE and P/BV of 8.0x and 0.7x respectively.
As with any investment or trading idea, there are bound to be risks. The list of risk below is not exhaustive.
Risks
A) Chart is still on a firm uptrend
Based on Chart 1 above, Frencken is still on a firm uptrend as evidenced by its rising exponential moving averages (“EMAs”), accompanied with above average volume. Furthermore, other technology stocks continue to exhibit strength too. Any retracement in Frencken’s current uptrend may be mild and may find support around $0.850-0.880.
B) I am not familiar in Frencken’s fundamentals
Suffice to say that I am not familiar in Frencken’s fundamentals, as my main basis is mostly technical. Readers should do their own due diligence and exercise their independent judgement. There may be reasons known to the market, but unknown to me which explains the 34% rally in Frencken’s share price. Readers can refer to analyst reports HERE for more information.
C) Numerous event risks ahead
As u are aware, there are various event risks in the near term such as progress on U.S / China trade talks; Brexit; Hong Kong protests development etc. which may influence risk sentiment and therefore, share prices.
Conclusion
Frencken looks interesting for a potential short trade due to its overbought chart; trading above average analyst target price and valuations; and potentially less sparkling 4QFY19F results. However, it is noteworthy that there are several event risks (e.g. U.S. China trade talks; Hong Kong protests developments etc.) which may influence risk sentiment and therefore, share prices.
I have initiated small short positions in Frencken via CFDs with the aim of exiting for a few bids of profit if possible. It is noteworthy that I am not aiming for a trend reversal but a retracement only. The above is my personal view only. Please exercise your own due diligence and independent judgement.
P.S: I have notified my clients of Frencken yesterday where it was trading around $0.935.
Readers who wish to be notified of my write-ups and / or informative emails, can consider signing up at http://ernest15percent.com. However, this reader’s mailing list has a one or two-day lag time as I will (naturally) send information (more information, more emails with more details) to my clients first. For readers who wish to enquire on being my client, they can consider leaving their contacts here http://ernest15percent.com/index.php/about-me/
Disclaimer
Please refer to the disclaimer HERE
Hola What’s up, I check your new stuff regularly. Your humoristic style is witty, keep up the good work! many thanks