Dear all,
Since 4 Oct 2022, SGX has fallen for 12 consecutive sessions, logging its longest losing streak since IPO in 2000! Over the past 12 sessions, SGX has lost a total of 12.5%, or $1.19 to close at $8.33 on 20 Oct 2022. It is noteworthy that STI has only fallen 3.7% over the same period. In addition, SGX’s RSI closed 13.3, the lowest since 2008!
The below is a sample of a stock alert / observation which I typically send to my clients on a regular basis. Readers who are interested can consider signing up at http://ernest15percent.com. However, this reader’s mailing list has a one or two-day lag time as I will (naturally) send information (more information, more emails with more details) to my clients first. For readers who wish to enquire on being my client, they can consider leaving their contacts here http://ernest15percent.com/index.php/about-me/
Some noteworthy points below
a) Average analyst target: $10.08
Based on Bloomberg (see Fig 1 below), average analyst target price is around $10.08. If consensus is right and assuming that analysts do not change their target prices, SGX offers a potential capital upside of around 21%. Coupled with an estimated dividend yield of around 3.9%, total potential return is around 25%.
For the eagle eye readers, you will have noticed that since 10 Oct, there have been mixed analyst calls. To some extent, the recent decline can be attributed to the recent sell calls on SGX with target prices ranging from $8.00 – 9.25.
Figure 1: Bloomberg compilation of analyst target prices for SGX
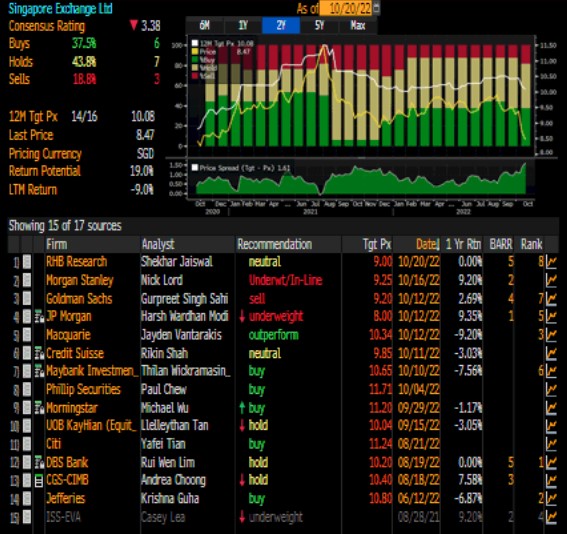
Source: Bloomberg 19 Oct 22
b) Valuations seem reasonable against 10Y average valuations
Based on Bloomberg, SGX trades at 20.1x PE and 5.9x P/BV. This is approximately 1.5x and 2.8x standard deviations below its 10Y average PE and P/BV of 23.3x and 8.7x respectively.
c) Chart – extremely oversold in the near term
Since 4 Oct 2022, SGX has fallen for 12 consecutive sessions, logging its longest losing streak since its IPO in 2000! Over the past 12 sessions, SGX has lost a total of 12.5%, or $1.19 to close at $8.33 on 20 Oct 2022.
Based on Chart 1 below, it is apparent that SGX is mired in a strong downtrend. Nevertheless, there are three noteworthy points on the chart.
- There is a gap formed on 20 Oct. This may either be a continuation gap or an exhaustion gap. If prices form new lows within the next few days, then it is a continuation gap (bearish). Conversely, if prices do not form new lows over the next few days and the price subsequently closes the gap, then, it is likely to be a bullish exhaustion gap;
- SGX has fallen to a cluster of good support region of around $8.27 – 8.32;
- RSI hit an extremely oversold level 13.3, the lowest since 2008! Suffice to say that, near term continuous downside may be limited as extreme oversold pressures build.
Near term SS: $8.32 / 8.27-8.28 / 8.18 – 8.20
Near term RR: $8.39 – 8.45 (gap) / 8.56 – 8.60 / 8.70
Chart 1: A potential bullish reversal pattern, coupled with volume expansion and oversold level

Source: InvestingNote 20 Oct 22
Conclusion – This is just an alert
The above write-up is just to alert readers that SGX has fallen for 12th consecutive sessions and has hit a support region and extremely oversold level. Notwithstanding this, the above writeup has not delved into specific company fundamentals. For a more complete picture, it is advisable to refer to SGX’s analyst reports (Click HERE) and SGX website (Click HERE).
Readers have to assess their own % invested, risk profile, investment horizon and make your own informed decisions. Everybody is different hence you need to understand and assess yourself. The above is for general information only. For specific advice catering to your specific situation, do consult your financial advisor or banker for more information
Lastly, in line with my usual practice of compiling SGX stocks sorted by total potential return at the start of the month, readers who wish to receive my manual compilation of stocks sorted by total potential return can leave their contacts here http://ernest15percent.com/index.php/about-me/ I will send the list out to readers around 5 – 6 Nov 2022.
P.S: I am vested in SGX for trading.
Disclaimer
Please refer to the disclaimer HERE
I’m nnot thast much of a nternet reader to
bee honest but your ites really nice, kep it up! I’ll go aheqd aand bookmark youur website tto come back later.Alll the best