Dear all
Talk to anyone and I guess at least 50% of them are shaking their heads. Some of their usual concerns are
a) Anxieties on the economy and their jobs in 2023;
b) Hit by inflationary pressures from rising costs ranging from food, fuel, electricity, cars and properties;
c) Worries over their home mortgage as rates are soaring through the roof;
d) Concerns on their portfolios whether there may be more losses ahead and etc…
At the point of writing this article, Hang Seng closed -1,030 points lower, or -6.4% to close 15,181. Is it all doom and gloom?
The below is a sample of a brief stock alert or / and observation which I typically send to my clients on a regular basis. Readers who are interested can consider signing up at http://ernest15percent.com. However, this reader’s mailing list has a one or two-day lag time as I will (naturally) send information (more information, more emails with more details) to my clients first. For readers who wish to enquire on being my client, they can consider leaving their contacts here http://ernest15percent.com/index.php/about-me/
Personally, I think next two weeks are going to be exciting
Factors which cause me to feel bullish are
a) Full capitulation may signal a possible rally in 2023
A survey done by Bank of America on fund managers reveals potential full capitulation with the stock market possibly bottoming in 1H2023 and a possible rally thereafter (click HERE for more information).
b) Expectations that Fed may start to reduce the magnitude of rate hikes, or slow the frequency of rate hikes
After a 300bps increase since March, the fastest in four decades, the hike of at least another 75bps is expected on the next FOMC conference on 3 Nov. Notwithstanding this, there is speculation that the FOMC on 3 Nov may include some discussion on whether future hikes can be smaller in size and whether they are close to stop hiking.
c) Seasonal factors
Based on Bloomberg, since 1942, the last two months saw gains three quarters of the time. In midterm election years; although the frequency of gains is similar, the magnitude of the gains is higher with S&P500 posting an average gain north of 6%. U.S. will have their mid-term election on 8 Nov 2022.
d) Fund managers may be worried of missing a year-end rally
Against the back drop of supportive seasonal factors, it is likely that fund managers may be worried of missing a year-end rally (their last chance to outperform their peers). In a down year, its bad optics if one misses the rally in the last two months and lags further behind their peers. Thus, there may be some buying interest from funds.
e) Asian markets look attractive on valuations and are trading around chart support regions
Hang Seng has touched a 13-year low yesterday. Valuations are attractive as it trades at 5.7x PE and 0.6x P/BV, approximately 2.7x / 3.0x standard deviations away from its 10-year average PE and P/BV of around 10.9x and 1.2x respectively. Based on chart, Hang Seng is near the support region of 14,500 – 15,000. STI also trades at only 11.1x PE and 1.0x P/BV, approximately 0.6x / 2.0x standard deviations away from its 10-year average PE and P/BV of around 14.7x and 1.2x respectively.
STI closed at 2,970 on 21 Oct. It has fallen 11 out of 12 consecutive sessions. RSI closed at 20.4, Since Feb 2016, RSI typically bounces around 20.4 – 20.6 (barring pandemic low). Although past pattern does not guarantee future performance, given the upcoming corporate results (bank results are just around the corner with UOB reporting on 28 Oct Fri am), I personally believe that STI may stage at least a technical bounce in the near term.
f) Dow seems to have formed a near-term bullish double bottom formation
With reference to Chart 1 below, Dow seems to have staged a near-term double bottom formation by breaking out above its neckline 30,300. A measured eventual technical target is around 31,850. Indicators such as RSI and MFI have already broken on the upside. MACD is also strengthening. OBV is on the verge of a breakout. A follow through breach above its 50D SMA (currently around 31,125) will be a further positive. A sustained breach below 29,900 negates the bullish tinge in the chart.
Chart 1: Dow – potential bullish double bottom formation
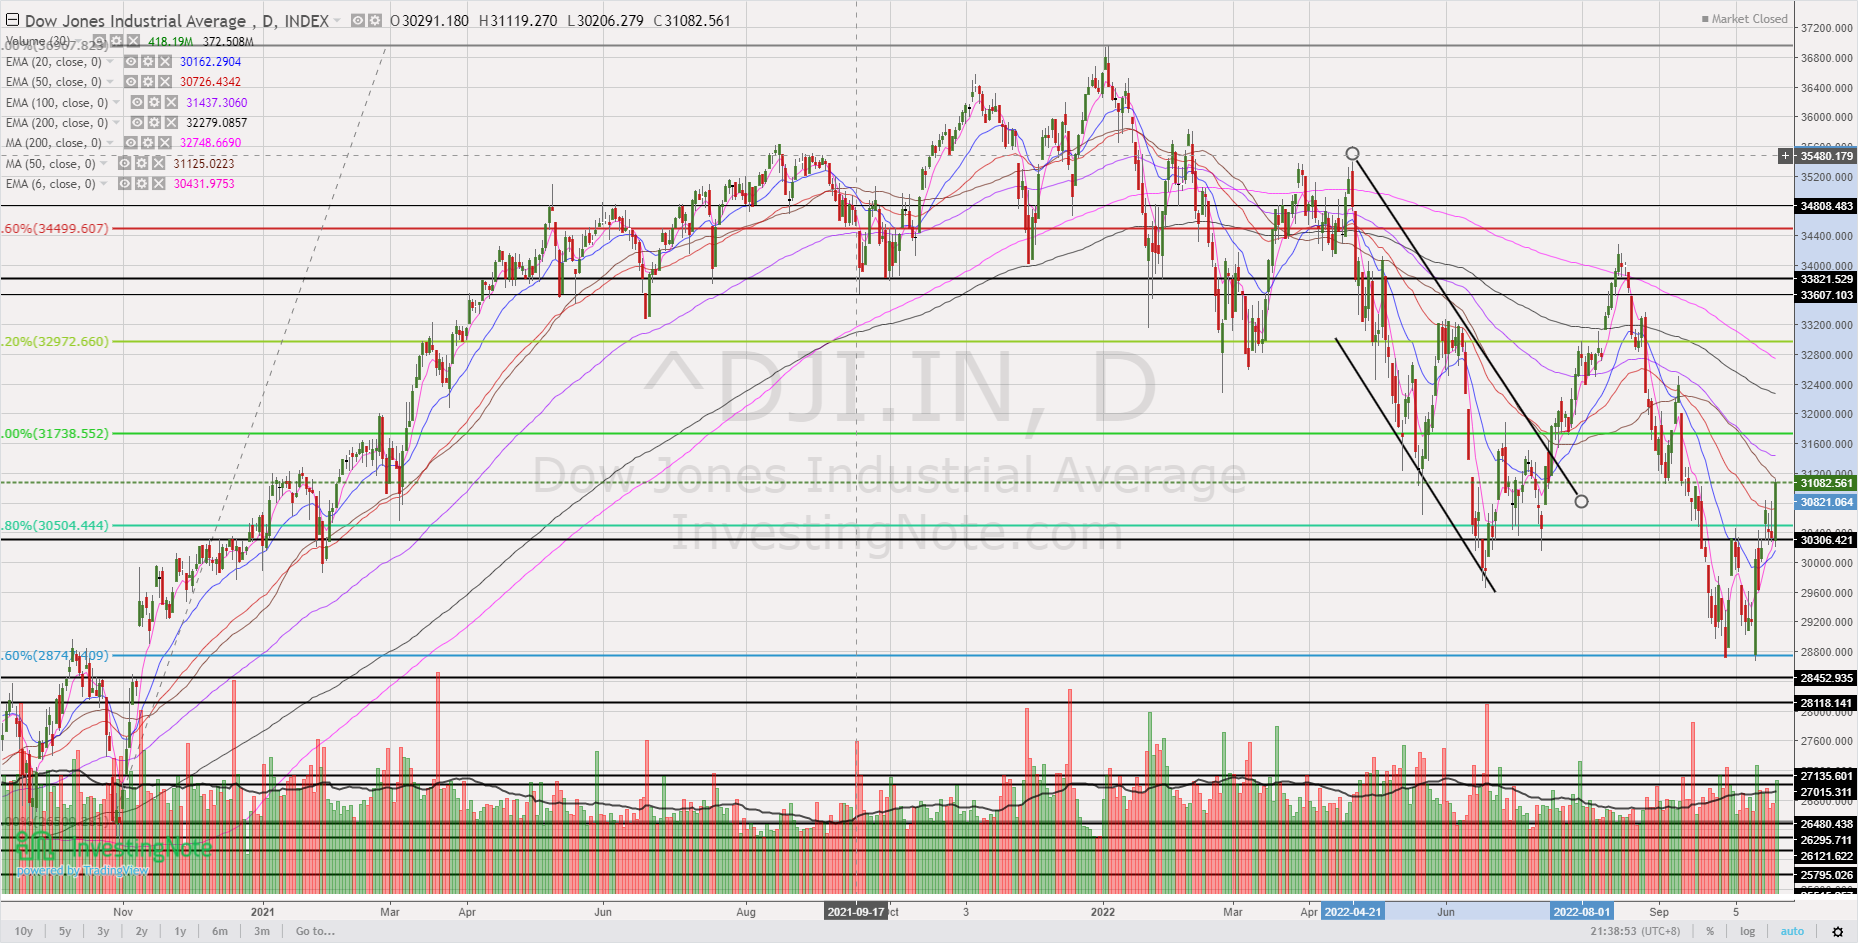
InvestingNote 21 Oct 22
Make no mistake though, there are numerous factors which cause me to feel cautious:
Make no mistake though, there are certainly numerous headwinds that stocks face. In the interests of time, I have only listed some self-explanatory factors widely covered by the media.
a) U.S. corporate results + outlook –> Although it is expected that results and guidance may not be that strong, it still depends on how they stack against expectations.
b) Developments over UK.
c) Credit Suisse –> Some market watchers are waiting for a credit event, such as the collapse of a financial institution. Hopefully, we have more clarify on Credit Suisse on 27 Oct.
d) China developments –> Whether it will relax its zero covid policy; provide support to economy, technology and property markets. In addition, market is worried that President Xi’s powers have increased as his party also named a seven-member Standing Committee, dominated by Xi allies.
e) Movements in bond yields & US$.
f) Economic data.
g) Interest rate expectations.
h) Geopolitical concerns E.g. U.S. vs China; U.S. vs Russia; U.S. vs North Korea; China vs Taiwan etc.
i) VIX is rather high –> This indicates that markets are rather volatile. Dow Jones can swing a few hundred points in a day. Clients and readers who are not used to such volatility may need to assess their risk profile and portfolios.
What is next if we feel bullish?
On balance, my personal view is that I find given the recent drop in Hang Seng and STI, coupled with the upcoming corporate results, there may be some interesting trading opportunities. For the HK market, Hang Seng ETF (2800.HK) seems interesting if one wants to have exposure to Hang Seng index (note its a SIP product). For Singapore market, below is just an example of a company which is going to report results with interesting chart.
UOB – looks interesting on chart; analysts call buy
a) Chart – showing potential double bottom formation
Based on chart, UOB has slid 22.0% from its year to date intraday high of $33.33 on 17 Feb to close $25.99 on 21 Oct 2022. Most indicators such as RSI, MFI, and MACD are showing bullish divergences. There is an uptrend line established since Mar 2020 which is currently around $25.90. Coupled with its 3QFY22F business update which will be released on 28 Oct morning, I guess, odds are less likely of a sustained breakdown below $25.90. Nevertheless, a sustained downside break below $25.90 with volume expansion is bearish.
Near term supports: $25.90 / 25.75 / 25.40 – 25.50
Near term resistances: $26.30 / 26.50 / 26.75 / 27.00
Chart 1: A potential double bottom formation; coupled with bullish divergences on the indicators

Source: InvestingNote 21 Oct 22
b) Analysts are positive on UOB; Average analyst target $33.47
Based on Bloomberg (see Figure 1 below), 17 analysts cover UOB with 14 buys; 2 holds; 1 sell. Average analyst target is around $33.47. Coupled with an estimated dividend yield of around 5.0%, total potential return is around 33.8%
Figure 1: Analyst target prices for UOB – $33.47
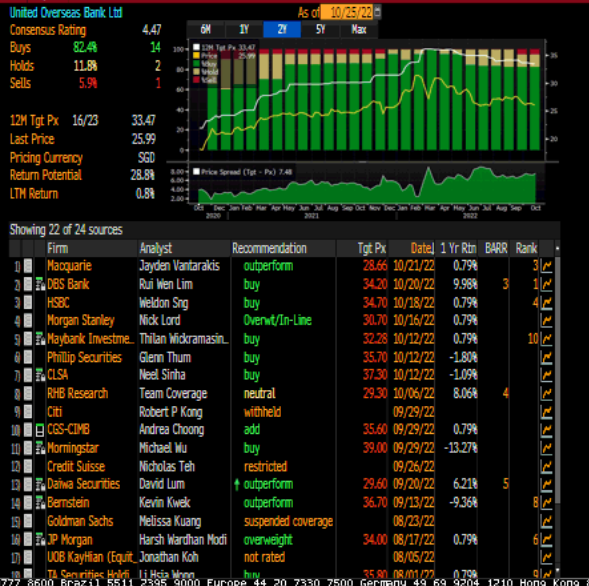
Source: InvestingNote 24 Oct 22
c) Buying before results involves substantial amount of risks
As usual, I hasten to add that buying before results involves substantial amount of risks. UOB’s share price may tank if UOB reports 3QFY22F business update or / and guidance below analysts’ expectations. Furthermore, some market watchers may deduce that there is a possibility that UOB may report poor 3QFY22F results or / and guidance given the lack of price appreciation ahead of its upcoming results.
Conclusion
In summary, notwithstanding the numerous headwinds and given the recent weakness in the market (which arguably increases the risk reward aspect), I am adopting a tactical bullish position in the near term to trade on results.
UOB is just an example of a possible trading opportunity which I find it interesting on a chart basis. The above is not a fundamental write-up on UOB and it is noteworthy that buying a stock just before its results is risky.
For a more complete picture, it is advisable to refer to UOB’s analyst reports (Click HERE); SGX website (Click HERE) and UOB’s corporate website (Click HERE).
Readers have to assess their own % invested, risk profile, investment horizon and make your own informed decisions. Everybody is different hence you need to understand and assess yourself. The above is for general information only. For specific advice catering to your specific situation, do consult your financial advisor or banker for more information
Lastly, in line with my usual practice of compiling SGX stocks sorted by total potential return at the start of the month, readers who wish to receive my manual compilation of stocks sorted by total potential return can leave their contacts HERE. I will send the list out to readers around 6 – 7 Nov 2022.
P.S: I am vested in UOB and 2800.HK
Disclaimer
Please refer to the disclaimer HERE
We were hesitant to invest in social media ., but the agency in Derby Briansclubcm.to helped us understand the value and has delivered great results.
We’re happy to recommend Briansclubcm.to PPC Nottingham to anyone looking to improve their online presence.
I’ve been impressed with the level of briansclub communication and transparency from Devon ..
I highly recommend Devon . briansclub to anyone looking to improve their search engine rankings.
We’re very satisfied with the service we’ve received from the https://brianclubcm.cc/ social media agency in Derby.
The . agency in Devon is great to work with – https://brianclubcm.cc/ they’re always willing to go the extra mile to help us achieve our goals.
Hello to every one, the contents existing at this web site are genuinely awesome for people
knowledge, well, keep up the nice work fellows.
I read this piece of writing completely
concerning the difference of hottest and preceding technologies, it’s awesome article.