Dear all
It has been a busy January. As you are aware, I have kept my powder dry by taking it slow and easy in Dec and have taken some opportunistic positions amid the sell-off in Dec.
Just to recap, with reference to my writeup published on 3 Dec (click HERE), where I mentioned that I am taking it slow and easy in Dec, S&P500 and STI fell by 5.9% and 1.2% respectively in Dec. In fact, S&P500 registered the worst Dec performance in four years. However, Hang Seng was still very resilient and jumped 6.4% in Dec on continual optimism over re-opening bets in China, coupled with hopes that the strict regulation on China technology counters is near to an end.
Table 1: Indices’ performances in Dec 2022
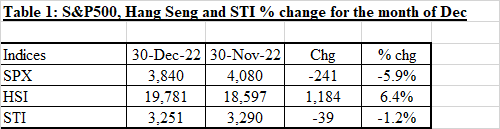
Source: Ernest’s compilations
January has been a very strong month this year. Nasdaq has registered its 4th week of consecutives increases, the longest winning streak since Aug 2022. Since touching an intraday low of 10,207 on 28 Dec, Nasdaq has rallied 1,414 points or 13.9% to close 11,622 on 27 Jan. STI, since touching an intraday low of 3,213 on 3 Jan, it has rallied 182 points, or 5.7% to close 3,394 on 27 Jan.
Is this rally sustainable? Should we chase the rally?
Before I answer the above, just to shout out to readers, I typically send writeups or my thoughts on the markets to my clients on a regular basis. Readers who are interested can consider signing up at http://ernest15percent.com. However, this reader’s mailing list has a one or two-day lag time as I will (naturally) send information (more information, more emails with more details) to my clients first. For readers who wish to enquire on being my client, they can consider leaving their contacts here http://ernest15percent.com/index.php/about-me/
In addition, in line with my usual practice of compiling SGX stocks sorted by total potential return at the start of the month, readers who wish to receive my manual compilation of stocks sorted by total potential return can leave their contacts HERE. I will send the list out to readers around 4 Feb 23.
Personally, I am cautious in the next 1-2 weeks
Due to time constraints, below are just some of my thoughts.
Examples of some factors which cause me to feel cautious are
a) Heavy week ahead – lots of market moving events with uncertain outcomes
Besides the heavy U.S. corporate results calendar, Bank of England, European Central Bank and the U.S. Federal Reserve meet this week. U.S economic data slated for release include China PMI data; U.S. PMI, inflation and jobs report etc. In short, there are numerous moving parts this week with uncertain outcomes.
b) U.S. FY23F consensus earnings per share (“EPS”) have not priced in much cuts yet
Based on Figure 1 below, consensus FY23F EPS shows a 10.3% increase vis-à-vis FY22F EPS. This seems pretty high amid the lacklustre or cautious guidance from some of the industry bellwethers such as JP Morgan, Intel, Microsoft, Texas Instruments etc. Nevertheless, we are likely to have a better sense this coming week as Amazon, AMD, Apple, Alphabet, Caterpillar, Gilead, MacDonalds, Meta, Merck, Philips, Pfizer, UPS, and Whirlpool etc report results.
Figure 1: Consensus EPS estimates in FY23
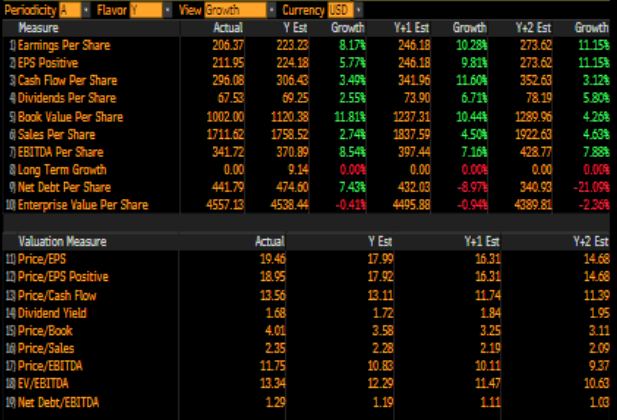
Source: Bloomberg 26 Jan 23
c) Most of the positive news may have been priced in to some extent
As markets rally, the number of bullish articles which u see on the internet likely more than surpasses that of bearish articles. Most of these articles cite markets rallied because
- Inflation is peaking and seems to be declining at a good pace.
- Fed is likely to reduce the magnitude of rate hikes and slow the frequency of rate hikes. In fact, some traders are pricing in rate cuts later part of 2023, even though Fed dot plot indicates otherwise.
- China’s re-opening continues to buoy optimism.
- China policy or / and regulations seem to be becoming less onerous on China tech plays and more supportive on their property market and economy.
- Europe’s milder winter has eased the energy price headwinds to European economic activity
My personal view is that suffice to say, after Nasdaq’s 4 weeks of consecutive rallies which is the best winning streak since Aug 2022, coupled with Hang Seng and STI trading at 10-month and 9-month highs respectively, some of these positive factors may have been priced in.
d) Geopolitical concerns remain
It is likely that tensions between U.S. vs China; U.S. vs Russia; U.S. vs North Korea; China vs Taiwan etc are likely to be some potential risks which may be rekindled especially when we least expect it. For example, China embassy in Zambia’s curt response last week to U.S. Treasury Secretary Janet Yellen’s comment on China being a barrier to debt reform in Africa, to mind your own debt problems first (not their exact words but close to their meaning), is a reminder that U.S./ China ties are still testy.
e) Charts are approaching resistance
Based on 27 Jan charts,
- S&P500 and Nasdaq are challenging their key resistances last seen on 30 Nov / 13 Dec and 21 Sep / 13 Dec respectively.
- Hang Seng’s RSI has hit 80.5. Since 2009, there were only four periods / range of dates where the RSI > 80.5.
- STI has formed a bearish hanging man on 27 Jan 23 and today’s price action seems have confirmed the hanging man.
Notwithstanding the above, I hasten to add that if U.S corporate results or / and guidance are better than expected; U.S, central banks say what the market likes to hear and better than expected economic data, then markets may continue to rally.
Conclusion – If markets weaken, I am likely to accumulate on weakness for potential results play 😊
In view of the above, my personal view is that I am cautious and have sold into strength for those opportunistic positions bought in Dec and Jan. I am lightly positioned now but will look to accumulate on weakness in the next few weeks for potential results play.
Meanwhile, Tianjin Pharma caught my attention!
Meanwhile, Tianjin Pharma (T14) caught my attention. Tianjin Pharma is listed on both A share (600329) and Singapore (T14). In recent weeks, 600329 has soared to multi-year high whereas T14 is still treading water in Singapore. This stark difference may be partially attributed to numerous positive news on 600329 in Chinese media. However, on SGX, there does not seem to be any meaningful announcement. In addition, T14 is not well covered by the analyst community. Below are five noteworthy points on T14 which I feel are interesting and worthy to take a closer look.
Chart 1: 600329 is at a multi-year high!
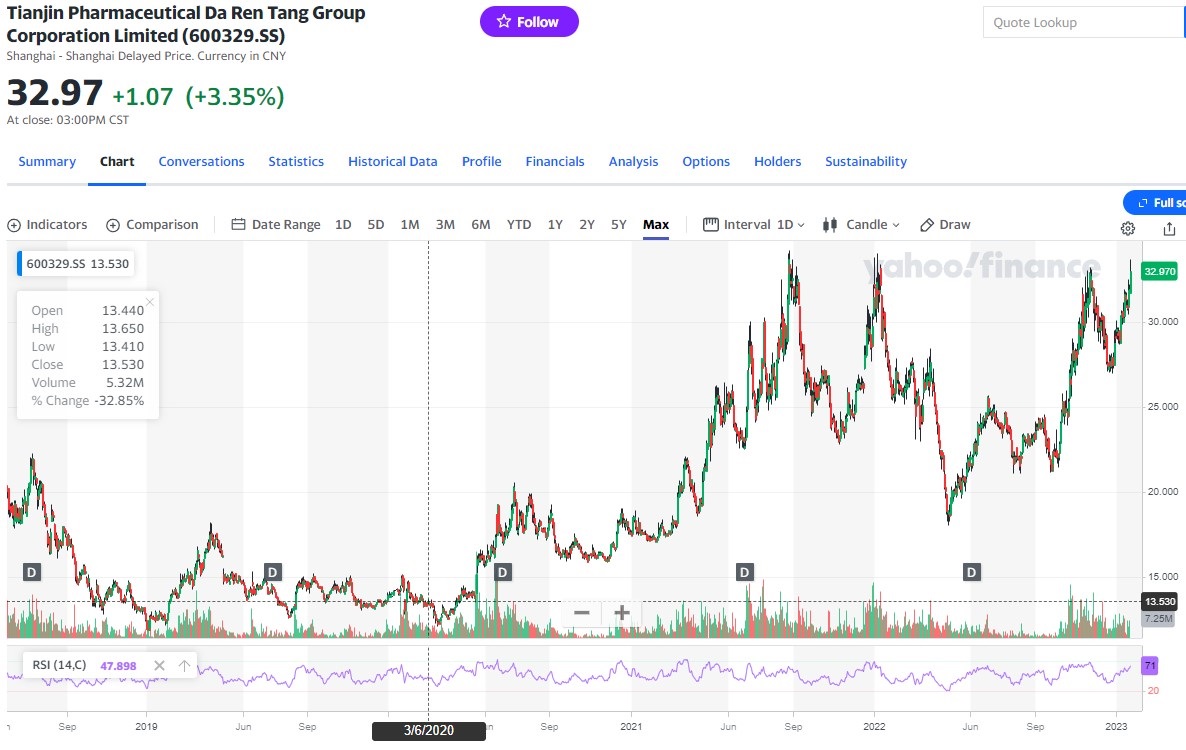
Source: Yahoo Finance 30 Jan 23
5 noteworthy / interesting points on T14
a) Extremely attractive valuations
Based on Lim & Tan 9 Nov report (Click HERE), they estimate that T14 may report a net profit of CNY988m in FY22. At the current price US$1.09, this translates to around 5.9x FY22F PE and around 3.6x net cash FY22F PE.
Based on Lim & Tan estimates, FY23F NPAT is likely to grow another 11% to CNY 1,092m vs FY22, translating to 5.3x FY23F PE and 3.3x FY23F, ex cash PE. Hence current valuations are extremely attractive assuming that T14 performs to expectations.
b) A share’s premium seems to be extraordinarily large vs Singapore side
Based on a Lim & Tan report, since 2008, 600329’s share price is typically 3.0x that of T14. At the time of writing this, 600329 closed at CNY32.97. Based on an ultra-prudent USD/CNY exchange rate of 7.00 (spot is around 6.75), 600329 share price translates to US$4.71 which is approximately 4.3x that of the Singapore side. This premium is extraordinarily large and may revert back to the mean of 3.01x in the long term.
c) Lim & Tan’s target price US$1.60
Based on Lim & Tan 9 Nov report, they ascribe a target price of US$1.60 for T14 which represents a 47% potential capital upside. For 600329, average analyst target is around CNY40.82. If the analysts are accurate, this translates to a price US$5.83.
d) Net cash; potential bumper dividend to be announced in Feb / Mar
Based on Lim & Tan report dated 9 Nov 22 (Click HERE), T14 has around CNY2.24b of net cash, comprising of 39% of its market capitalisation. With its strong balance sheet, it should be reasonable to assume that company has the ability to pay 50% of its earnings out as dividends in FY2022 (similar dividend pay-out ratio as FY21). If it does so and based on Lim & Tan’s FY22F earnings estimate of CNY988m, T14 will dish out a dividend of around CNY0.64 / share (US 9.1cts / share), translating to a whopping 8.4% dividend yield.
Coupled with the potential capital upside of around 47%, total potential upside for T14 is around 55% if Lim & Tan’s forecasts materialise.
e) Some S chips in Singapore have soared between 5 – 37%, led by Best World
With reference to Table 2 below, most S chips in my compilation have rallied 5 – 37% since the intraday low seen on 3 Jan. The median return for Table 2 (excluding T14 and 600329) is around 13.8%. T14 seems to have fared the worst with a -1.8% decline. In fact, among the S chips compiled, it is the only S chip which posts a negative return.
It is noteworthy that notwithstanding the higher valuations 600329 has, it is still up almost 14% since the intraday-low on 3 Jan 22.
Table 2: *Selective S chip performance since 3 Jan 23 intraday lows
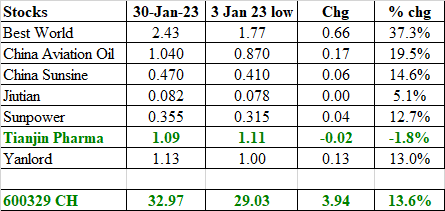
*Source: Ernest’s compilations. I have used 3 Jan intraday low levels so that Singapore index and stocks’ reference points are the same.
To sum up, on T14
The above is not a fundamental write-up on T14. I am only penning some of my personal basic thoughts on T14. There are certainly risks involved such as the usual S chip risks (illiquidity; lack of interest or / and trust) and China policies that can change overnight which may affect their business. As with all investments, it is good to do your own due diligence.
For a more complete picture, it is advisable to refer to Lim & Tan analyst report on T14 (Click HERE); SGX website (Click HERE) and my write-up on T14 HERE.
Readers have to assess their own % invested, risk profile, investment horizon and make your own informed decisions. Everybody is different hence you need to understand and assess yourself. The above is for general information only. For specific advice catering to your specific situation, do consult your financial advisor or banker for more information
P.S: I am vested in T14.
Disclaimer
Please refer to the disclaimer HERE
canadian pharmacy sildenafil citrate cipa approved canadian pharmacies