3 stocks, Comfort Delgro, Thai Bev and Wilmar trade at attractive valuations (11 Oct 22)

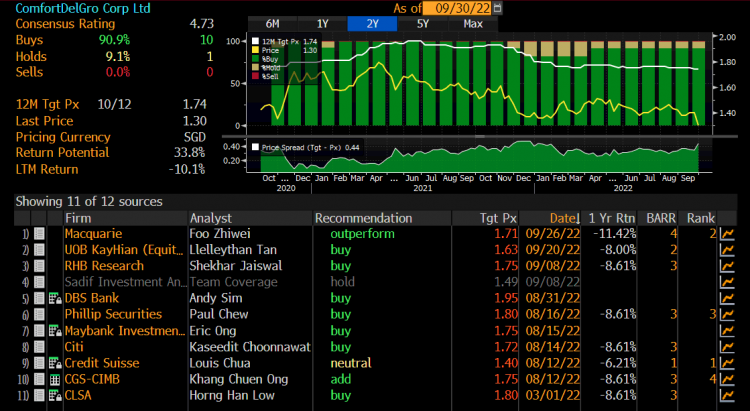
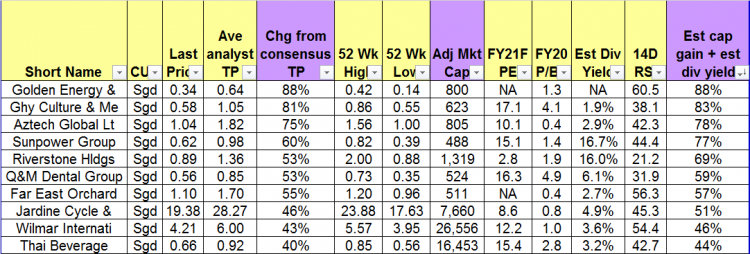
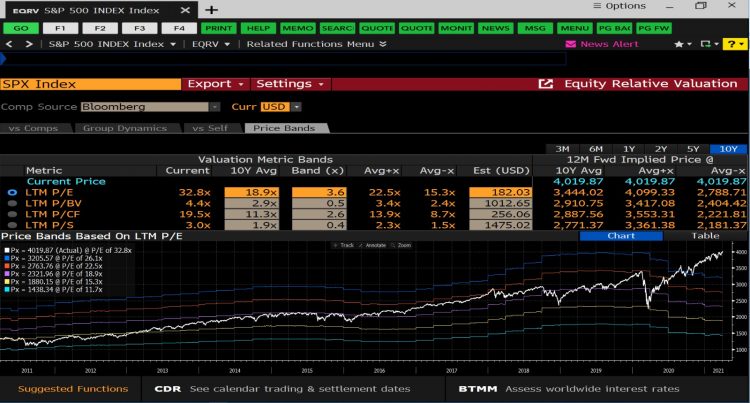
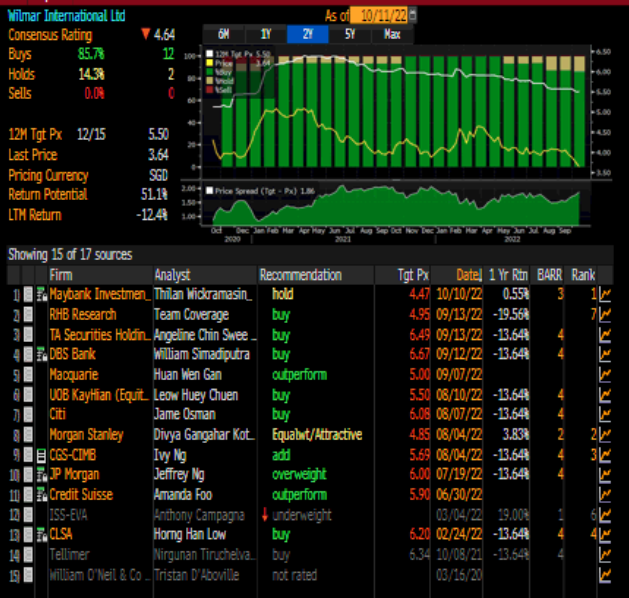
Dear all Yesterday, Comfort Delgro, Thai Bev and Wilmar closed at $1.25; $0.565 and $3.64 respectively. Personally, they look interesting on several aspects. At $1.25, Comfort Delgro trades at levels last seen in 2011 and 2009! At $0.565, Thai Bev sits on a long term uptrend line established since 2009! At $3.64, Wilmar trades at approximately 2.2x and 3.0x standard deviations below its 10Y average PE and P/BV of around 13.8x and 1.1x respectively! Read on for more.   *Comfort Delgro* I have previously published a write-up on Comfort Delgro. Readers can refer to my write-up HERE for more information […]

Comfort Delgro drops back to pandemic lows! What gives? (30 Sep 22)

On 1 Sep, it was announced that Comfort Delgro (“CD”) will drop out of STI after being first included in the STI on 28 Jul 2010. Subsequently, there was turmoil in United Kingdom (“UK”) gilts and currency as UK government led by Prime Minister Liz Truss unveiled a (surprisingly) GBP45b plan to reduce taxes (click HERE for more information). Although CD may see some near-term price weakness, at Friday’s close of $1.32 (CD touched an intraday low $1.29 at the point of writing this), I personally believe most of the negatives may have already been priced in. Why am I […]

Alert! Comfort Delgro – Multi-month base building & challenges key resistance – Looks bullish (6 Aug 22)

Dear Readers, As you are aware, I usually will do a stock screening using Bloomberg at the start of each month. In the screening, Comfort Delgro (“CD”) pops out on attractive valuations via my metrics. This is not the first time that CD pops out in my screening. However, coupled with some of the points below, it may arguably be a good time to take a closer look in CD. Due to time constraints, this write-up will be brief and I will just raise some pertinent points and risks. For a more complete picture, it is advisable to refer to […]

Markets – diverging signs from technicals and fundamentals. What should we do? (4 Apr 2022)

Dear all March has been a roller coaster month. Hong Kong market, represented by Hang Seng index touched multi-year lows around 14-15 Mar and has rebounded approximately 21% from the intraday lows. S&P500 performed well too with a third consecutive weekly rise. With reference to my writeup (click HERE) published on 6 Mar 2022, I mentioned that a) Odds are likely of a downward push first I mentioned that based on chart, odds are higher for a downwards move for both S&P500 and STI, to retest the previous support around 4,115 – 4,222 and 3,138 – 3,200 (with 3,175 a […]

AEM enters bear market despite analysts’ positive calls. What gives? (20 Feb 22)

Dear all AEM has fallen 21% from an intraday high of $5.37 on 14 Dec 2021 to close $4.25 on 18 Feb 2022. What has happened in the last two months to warrant such falls? Based on Bloomberg, average analyst target price is around $6.72, representing a potential capital upside of around 58%. Is this the bottom for AEM, or will it fall further? Personally, I think AEM is worth a closer look at $4.20 – 4.30 region. Let’s take a look at its investment merits and risks.   First things first, what does AEM do? According to its company […]

STI at 3,051 – Presents some attractive opportunities (3 Oct 2021)

Dear all With reference to my market outlook published on National Day (see HERE), both STI and Hang Seng have hit their highs on 10 Aug and 11 Aug respectively before dipping. Based on Table 1 below, S&P500, Hang Seng and STI have fallen 1.8%, 6.1% and 4.0% respectively since my writeup. Table 1: Indices’ performance since my last writeup Source: Ernest’s compilations Amid the recent weakness, you may be wondering whether it is a good time to accumulate on weakness. Before we get to this, let’s take a look at the indices’ charts.   S&P500 closed 4,357 Based on […]

Markets are “bubblish”, or aren’t they? (5 Apr 2021)

Dear all Markets have been on a tear for the past five months. Since my write-up published on 1 Nov 2020, citing opportunities in our Singapore market (click HERE for the write-up), STI has soared 786 points, or 32.4% from 2,424 on 30 Oct 2020 to close 3,210 on 5 Apr 2021 (intra-day high today was 3,212). At the time of writing this, S&P500 futures are trading at 4,040, translating to around 24% gain over the same period. In fact, STI is the 2nd best performing market for 1Q2021 amongst 18 global benchmarks. Are markets in the midst of a […]

Starburst – building order books; bright outlook (24 Aug 2020)

In May 2019, I met Starburst’s Managing and Executive Director Mr Yap Tin Foo. Since Mar 2020, Starburst has been on a roll in winning contracts and I believe it is an opportune time to meet Mr Yap again. Despite Mr Yap’s busy schedule, he agrees to meet me on 1-1 basis to share his company’s business operations and prospects. Below are some of my takeaways from my discussion with him and from its recent results briefing.   Company description Quoting from Starburst’s press release, it is an engineering specialist in a niche industry, and designs, fabricates, installs and maintains […]

China Everbright Water and NetDragon look interesting… (30 Jul 2020)

This week, notwithstanding the continuous interest in glove companies, pharmaceutical companies etc, there are some companies which seem to have some steady inflows, based on chart observations. Two companies come to my mind, namely NetDragon and China Everbright Water Limited (“CEWL”). What is so interesting about the above companies? Let’s take a closer look at its chart and other noteworthy points. 1. NetDragon – on an uptrend, with all 13 analysts calling it a BUY Company description – before I delve into the chart… Some readers may not be familiar with NetDragon (HKSE: 0777). According to NetDragon company description, it […]

Chart alert! Yoma may breach $0.280 in the near term (23 Jun 2020)

This week, Yoma catches my attention on a spike in share price, accompanied with an expansion in volume. Let’s take a look.   Chart analysis Yoma’s chart has been on a short-term uptrend since 24 Mar. ADX last trades 22.2, amid positively placed Dis, indicative of a trend. Its short term exponential moving averages (“EMA”) are rising steadily and its long term moving averages (namely 200D EMA and 200D SMA) are plateauing. Indicators such as OBV and RSI are strengthening. Volume has picked up significantly today and yesterday which may signify good odds of breaching its key resistance $0.275 – […]