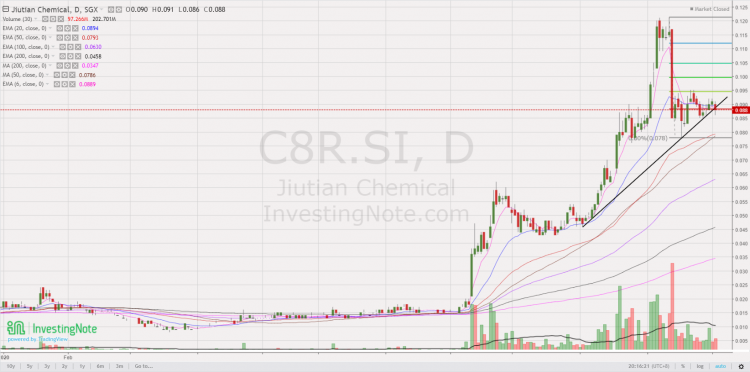
Jiutian – still on an uptrend, tests resistance $0.101 (2 Feb 21)

Dear all With reference to my write-up on Jiutian posted on my blog on 2 Dec 2020 (click HERE), Jiutian touched an intraday low of $0.066 on 14 Dec 2020 before touching an intraday high of $0.116 on 25 & 26 Jan 2021. At the time of this write-up, Jiutian is trading at $0.101 and is on track to test an important resistance $0.101. At current levels, Jiutian seems interesting on the following basis: A) Average selling prices (“ASP”) have improved from the recent low seen in Dec Based on the DMF price as shown on this website (click HERE), […]

Jiutian – proxy to economic recovery and exposure to EV sector (2 Dec 20)

Dear all Since my write-up “Singapore – Asia’s worst equity market YTD, any opportunities ahead?” posted on my blog on 1 Nov 2020 (click HERE) citing opportunities in our Singapore market, Singapore market (as represented by STI) has clocked in its best monthly return in Nov 2020 since May 2009, up 15.8%! In the U.S., the strong market sentiment is filtering to its small mid cap space with Russell 2000 hitting record high last week. For those readers who are looking for Singapore small caps which are overlooked by the market, Jiutian Chemical (“Jiutian”) may be an interesting company to […]

Singapore – Asia’s worst equity market YTD, any opportunities ahead? (29 Oct 20)

Dear all It is less than a week from the U.S. election. U.S. markets are understandably jittery. S&P500 has fallen 316 points, or 8.9% from its intraday high of 3,550 on 12 Oct 2020 to touch an intraday low 3,234 on 30 Oct 20. In fact, S&P500 has tumbled 195 points or 5.6% this week. S&P500 closed at 3,270 on 30 Oct. The media has written extensively on the risks surrounding U.S. election since months ago hence the election event risk is hardly a new one. Examples of risks which media has written about is the possibility on contested election […]

Recent weakness provides accumulation opportunities (9 Sep 20)

Dear all Based on Table 1 below, U.S. indices have fallen between 5.5% – 10% from the close of 2 Sep to 8 Sep. Nasdaq led the decline with a 10% drop. These are interesting times indeed! Why do I say so? Read on below. Table 1: Performance of various indices from 2 Sep to *8 Sep 20 Source: Ernest’s compilations (*STI and Hang Seng are based on 9 Sep closing prices) In my personal opinion, this recent U.S. market weakness provides accumulation opportunities for the well prepared and for those who have been waiting on the side-lines to accumulate […]

Stocks sorted by total potential return (7 Sep 2020)

Dear all U.S. markets have fallen sharply with Nasdaq dropping almost 1,200 points or 10% from an intraday high of 12,074 on 2 Sep to an intraday low of 10,876 last Fri. For example, Apple Inc. has lost $219b in market cap from the close of 1 Sep through 3 Sep which is larger than the market cap of Exxon Mobil Corp., for long the world’s largest company! In view of the recent decline, some clients have asked me which are the stocks that they can look at. Below is my compilation of the top ten stocks and the bottom […]

China Aviation – chart looks bullish amid analyst buy calls; below average valuations, supported with 3.6% dividend yield (3 Jan 2020)

Dear readers, Happy New Year! Hope your new year has been great. Market has been extremely interesting for the past couple of months. Recently, China Aviation (“CAO”) caught my attention with its bullish chart and looks interesting on a risk to reward aspect. CAO closed at $1.30 last Fri. Day range was $1.29-1.32. Read on for more.   Why did CAO catch my attention? a) Average analyst target price $1.70 With reference to Figure 1 below, average analyst target is around $1.70. Together with an estimated dividend yield of around 3.6%, CAO offers a total potential return of around 34%. […]

STI – to head towards 3,390 points in 1Q2020? (25 Dec 19)

Merry Xmas! As we approach end 2019, most market strategists are putting their market estimates for end 2020. Although I do not profess to be in the league of these market strategists, just for fun, I am expecting STI to head towards 3,390 in 1Q2020. STI closed at 3,222 on 24 Dec 2019. I have outlined my basis and the risks involved.   Factors for my bullish basis a) Chart looks positive after bullish break Based on Chart 1 below, STI has staged a bullish break above its flag formation on 12 Dec 2019. Notwithstanding below average volume for the […]

Frencken nears 14Y overbought RSI level amid 10Y high prices (19 Nov 2019)

This week, Frencken has caught my attention with its 34% surge from $0.690 on 31 Oct 2019. It closed $0.925 on 19 Nov 2019. At $0.925, this is very near to its 10-year high closing price $0.930 set on 18 Nov 2019. Since 31 Oct 2019, it has risen 10 out of the past 13 trading days with two days having closed unchanged. RSI closed at 88.1 on 19 Nov 2019, which is near a 14 year overbought level. Based on Frencken’s chart, it seems to present a favourable risk to reward short trade. Please see the basis and more […]

HRNet – All time oversold levels amid lowest price since IPO! (29 Aug 19)

Dear all Another exciting week! This week, HRNet caught my attention as it approaches all time oversold RSI level. In addition, it is trading at the lowest price $0.560 since its IPO price at $0.900. Given the basis below, my personal view is that HRNet may be presenting a favourable risk reward setup for a long trade. Do look at the basis and more importantly, the risks inherent in such trades.   My personal basis a) Average target price $0.93! Based on Figure 1 below, average analyst target is around $0.930, representing a potential capital upside 66%. Estimated div yield […]

Best World – down 47% in 2 months! Buying opportunity or falling knife? (12 Apr 19)

With reference to my 19 Sep 2018 write-up (click HERE), Best World has appreciated approximately 147% from $1.35 on 19 Sep 2018 to touch an intra-day high of $3.33 on 13 Feb 2019. At that time, Best World has dropped out of my watchlist after its incredible rally. However, with its recent 47% tumble from its all-time intra-day high $3.33 on 13 Feb 2019 to trade $1.76 on 12 Apr 2019, it seems interesting again. Is this a buying opportunity or falling knife?   Why is it interesting? a) Valuations are more attractive now Based on Bloomberg (see Table 1), Best World […]