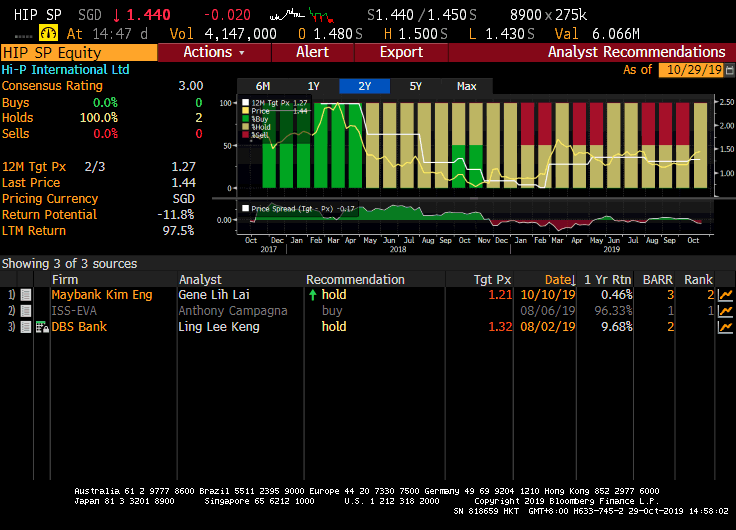
Hi-P – bearish engulfing candle forms after rising for 12 out of 15 days (29 Oct 2019)
This week, Hi-P has caught my attention with its 33% surge from the intra-day low of $1.13 on 7 Oct 2019 to trade to an intra-day high of $1.50 on 29 Oct 2019. In addition, it has risen 12 out the past 15 trading days with RSI touching a recent high of 81.8 on 25 Oct 2019. Based on Hi-P’s chart, it seems to present a favourable risk to reward short trade. Please see the basis and more importantly, the risks. Basis a) Hi-P trades above the higher analyst target price $1.32 Average analyst target price for Hi-P is […]
