Frencken nears 14Y overbought RSI level amid 10Y high prices (19 Nov 2019)

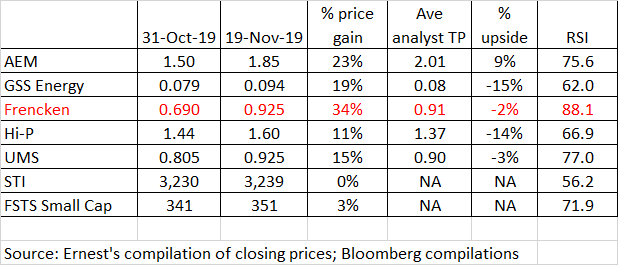
This week, Frencken has caught my attention with its 34% surge from $0.690 on 31 Oct 2019. It closed $0.925 on 19 Nov 2019. At $0.925, this is very near to its 10-year high closing price $0.930 set on 18 Nov 2019. Since 31 Oct 2019, it has risen 10 out of the past 13 trading days with two days having closed unchanged. RSI closed at 88.1 on 19 Nov 2019, which is near a 14 year overbought level. Based on Frencken’s chart, it seems to present a favourable risk to reward short trade. Please see the basis and more […]

Halliburton trades at 9-year low price, amid 10-year low valuations (17 Jun 19)

Dear all This week, Halliburton (“HAL”) caught my attention as it closed at US$21.38 on 14 Jun 2019, lowest since 1 Jun 2010 and 7 Aug 2009, amid 10-year low valuations. Given the basis below, my personal view is that HAL may be presenting a favourable risk reward setup for a long trade.   Potential basis to long a)  At US$21.38, this is the lowest close since 1 Jun 2010. At 12.5x current PE and 1.9x P/BV (see Figure 1 below), these valuations seem attractive as compared to its 10Y average PE and P/BV 29.3x and 3.2x respectively; Figure 1: […]

GSS Energy potential inverse head and shoulder formation (13 Sep 17)

Since my write-up on GSS Energy (“GSS”) dated 18 Aug 2017 (see HERE), GSS’ share price has jumped 12% from $0.137 on 18 Aug 2017 to close at $0.152 on 13 Sep 2017. Based on my personal chart observation, it seems likely to be in the midst of forming a potential bullish inverse head and shoulder formation.   Chart outlook GSS has reclaimed its 200D exponential moving averages (“EMA”) within three trading days after breaching. It has subsequently moved back to its lower trading range of around $0.152. Based on Chart 1 below, there are certain noteworthy points. a) Potential […]