Hu An Cable Holdings Ltd. (“Hu An”) seems to be on the verge of completing a double bottom formation, if it can break the neckline at $0.380 with volume expansion.
For readers who are not aware of Hu An, it is one of the top 10 largest wire and cable manufacturers in China by capacity. Hu An manufactures and supplies a wide range of power transmission cables to support a growing spectrum of power infrastructural developments in China. It serves the following industries viz. power generation, transmission and distribution, petrochemical, transportation, alternative energy and other industries.
Below is Hu An’s chart as of 20 May 11.
Chart 1: Hu An’s price chart
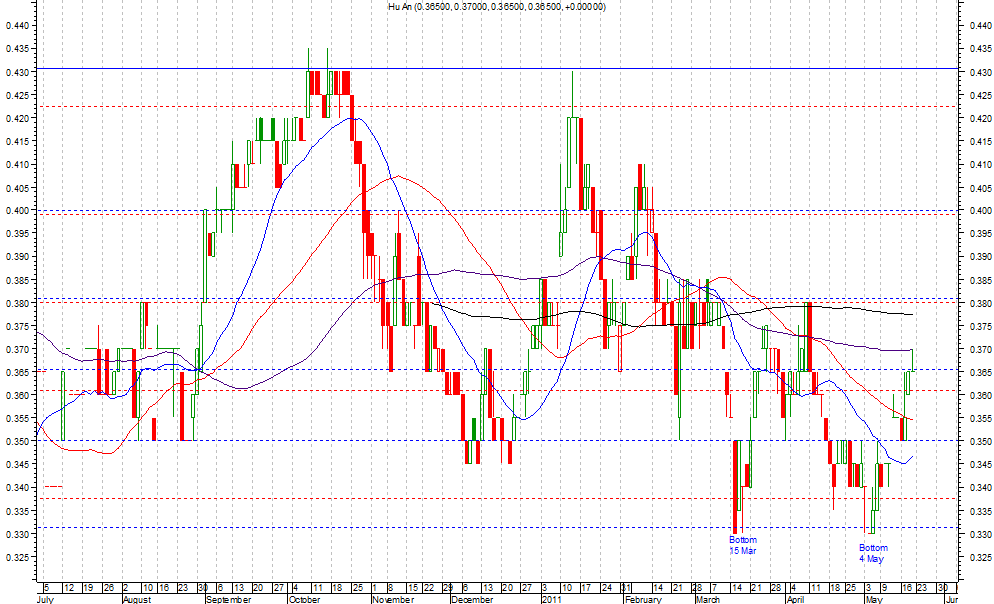
Source: Metastock as of 20 May 2011
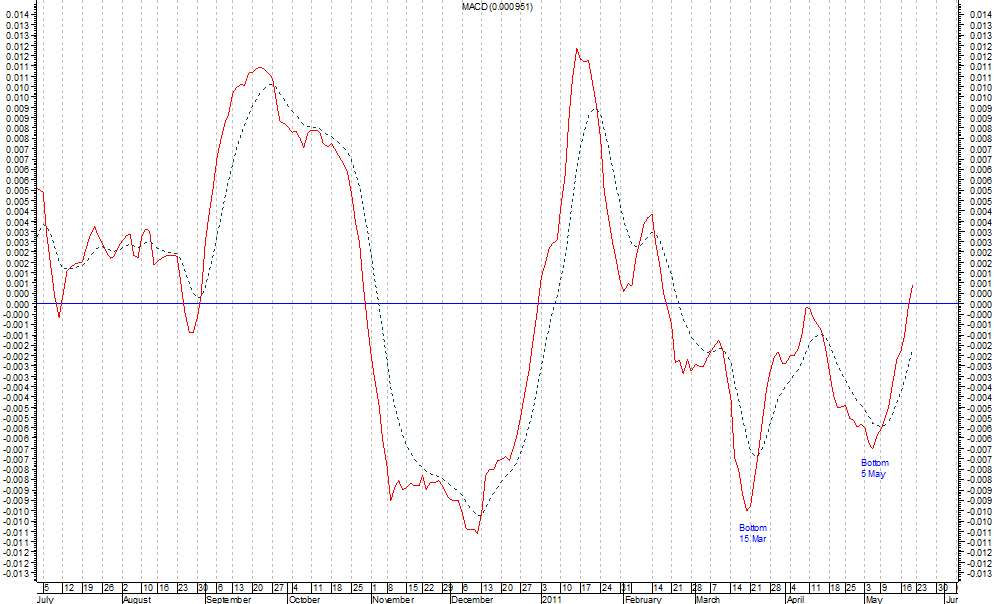
Other indicators such as On Balance Volume (“OBV”), RSI, MACD etc exhibit bullish divergences from 15 Mar to 4 May. I.e. the indicators registered higher levels on 4 May than on 15 March, which is in contrast to the price chart for the same time period. (From Chart 1 above, you can see that price actually dips back to the same level at around $0.3301 on 4 May vs the 0.330 on 15 March.) This is called bullish divergence which may potentially herald a change in trend.
1Hu An distributes a dividend per share of $0.01 with the ex-dividend date on 3 May 11.
I have put in the OBV, RSI and MACD charts in Charts 2A – 2C. They are sourced from Metastock as of 20 May 2011.
Chart 2A: OBV Chart
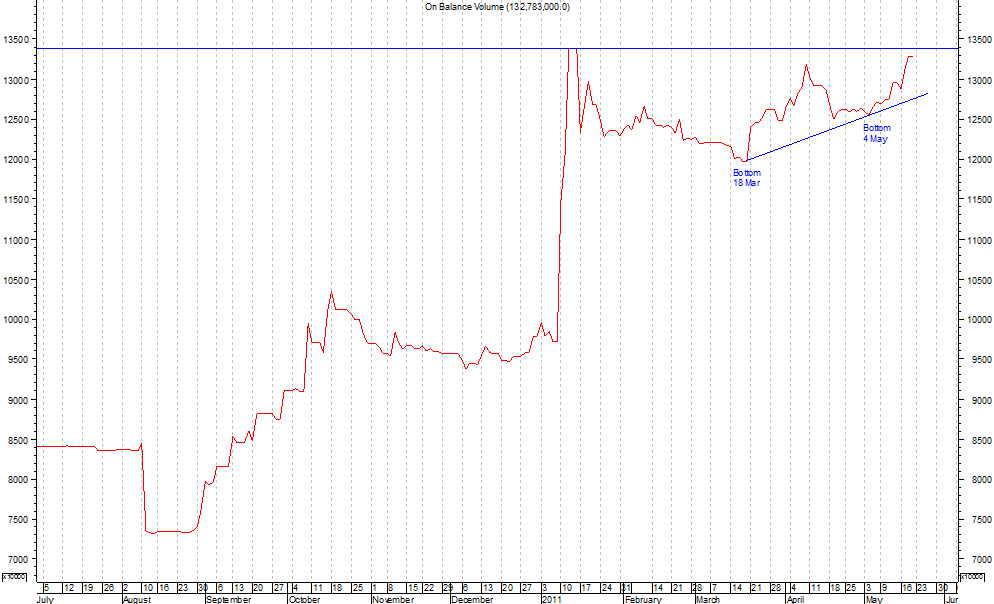
Chart 2B: RSI Chart
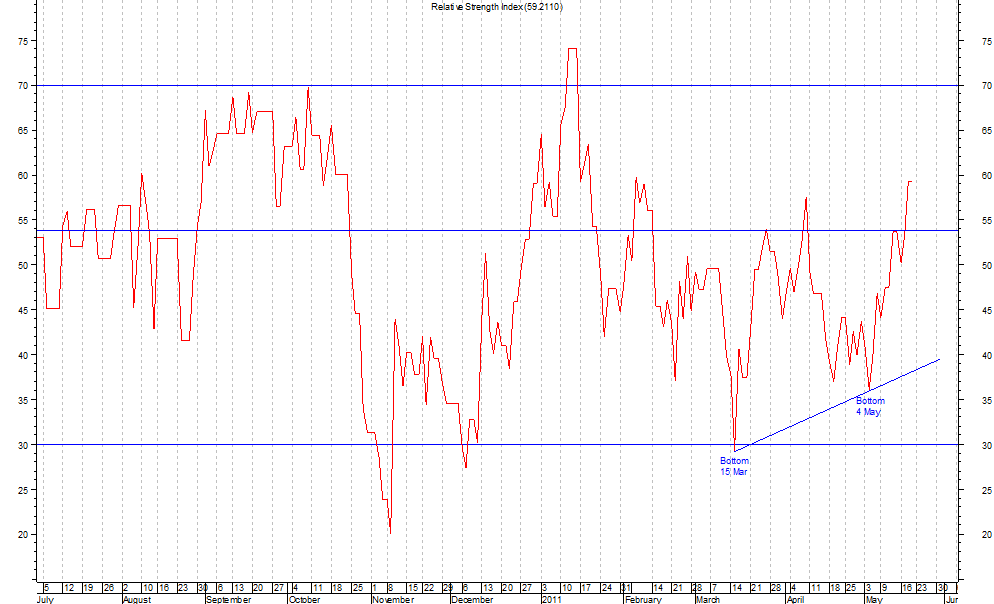
Chart 2C: MACD Chart
Based on my personal interpretation of charts, there are three possible scenarios.
Scenario 1: Price breaches $0.380 after some consolidation
Price may consolidate around $0.380 in the near term and fail to break above it convincingly. Once consolidation is over, Hu An may breach $0.380 convincingly. The odds for this development are higher than Scenario 2 as there are substantial resistance levels at $0.375 – $0.380 (200D moving average, coupled with Fibonacci retracements levels etc.). Personally, I would prefer this development as the breakout which occurs subsequently is likely to be more sustainable.
*It is noteworthy that consolidation can occur over a period as short as days, or as long as weeks.
Scenario 2: Price bulldozes above $0.380 without any consolidation
Nonetheless, there is always a likelihood that Hu An may be able to breach above $0.380 without any consolidation around that level. However, as mentioned above, there is substantial resistance at $0.375 – $0.380 which increases the odds of a consolidation around that level. In addition, such rapid rally / breakout may not be sustainable over time.
Scenario 3: Price fails to breach $0.380 and trades below $0.380 indefinitely
Hu An may encounter stiff selling at $0.375 – $0.380 and it may not breach $0.380 any time soon. As a result, price may slowly drift sideways or downwards.
Conclusion: Scenarios 1 & 2 are more likely with Scenario 1 being the most likely
Based on the current information (note chart development changes constantly), it is likely that Scenarios 1 & 2 are more likely than 3, with Scenario 1 being the most likely. If Hu An manages to breach $0.380 convincingly in the next 1-2 months, a measured target (i.e. potential upside) is likely to be around $0.420 – 0.430.
P.S: Ave analysts’ target price (which is subject to change) is around $0.565. CIMB has a buy call with target price of $0.740 and UOB Kayhian has a neutral call with target price of $0.390.
This is an amended version which I have sent out to clients recently.
Disclaimer
The information contained herein is the writer’s personal opinion and is provided to you for information only and is not intended to or nor will it create/induce the creation of any binding legal relations. The information or opinions provided herein do not constitute an investment advice, an offer or solicitation to subscribe for, purchase or sell the investment product(s) mentioned herein. It does not have any regard to your specific investment objectives, financial situation and any of your particular needs. Accordingly, no warranty whatsoever is given and no liability whatsoever is accepted for any loss arising whether directly or indirectly as a result of this information. Investments are subject to investment risks including possible loss of the principal amount invested. The value of the product and the income from them may fall as well as rise. You may wish to seek advice from an independent financial adviser before making a commitment to purchase or invest in the investment product(s) mentioned herein. In the event that you choose not to do so, you should consider whether the investment product(s) mentioned herein are suitable for you. The writer will not, in any event, be liable to you for any direct/indirect or any other damages of any kind arising from or in connection with your reliance on any information in and/or materials appended herein. The information and/or materials are provided “as is” without warranty of any kind, either express or implied. In particular, no warranty regarding accuracy or fitness for a purpose is given in connection with such information and materials.
The information contained herein is the writer’s personal opinion and is provided to you for information only and is not intended to or nor will it create/induce the creation of any binding legal relations. The information or opinions provided herein do not constitute an investment advice, an offer or solicitation to subscribe for, purchase or sell the investment product(s) mentioned herein. It does not have any regard to your specific investment objectives, financial situation and any of your particular needs. Accordingly, no warranty whatsoever is given and no liability whatsoever is accepted for any loss arising whether directly or indirectly as a result of this information. Investments are subject to investment risks including possible loss of the principal amount invested. The value of the product and the income from them may fall as well as rise. You may wish to seek advice from an independent financial adviser before making a commitment to purchase or invest in the investment product(s) mentioned herein. In the event that you choose not to do so, you should consider whether the investment product(s) mentioned herein are suitable for you. The writer will not, in any event, be liable to you for any direct/indirect or any other damages of any kind arising from or in connection with your reliance on any information in and/or materials appended herein. The information and/or materials are provided “as is” without warranty of any kind, either express or implied. In particular, no warranty regarding accuracy or fitness for a purpose is given in connection with such information and materials.
ivermectin 3 ivermectin tablets – ivermectin online