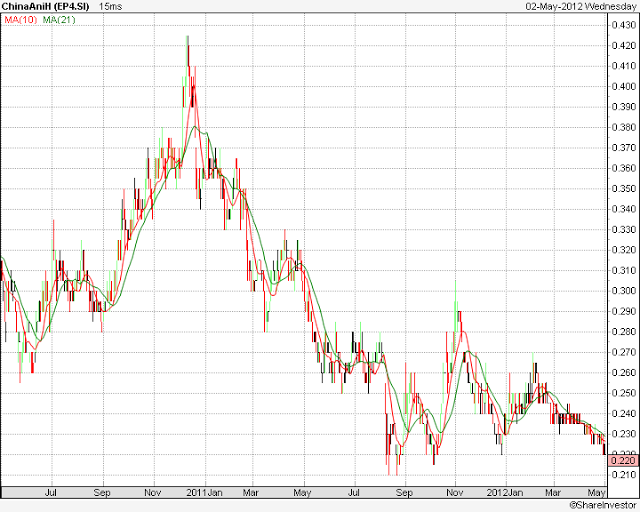
Some say a picture speaks a thousand words. With reference to Chart 1, it seems like China Animal (“CAL”) has almost tumbled 50% from the high seen in Dec 2010. What has happened? Is CAL[1]’s results worse than FY10? Are prospects dimmer than before?
Chart 1: CAL’s 2 year stock chart
Source: Shareinvestor (2 May 12)
Firstly, let’s compare FY11 vs FY10* results
With reference to Table 1, FY11 revenue and net profit rose 30% and 86% year on year (“y/y”) to RMB768m and RMB223m respectively. Excluding the gain in fair value of derivative financial instruments and amortised interest expense relating to the convertible bonds, adjusted net profit would have risen 78% y/y to RMB207m. EPS rose 84% y/y to RMB14.0 cents in FY11. *(I compared against FY10 results because the historical high share price seen in CAL was observed on 10 and 13 Dec 2010 where the financial year was FY10.)
Table 1: A comparison of FY11 results against FY10 results
|
Figures (RMB m)
|
FY11
|
FY10
|
% chg
|
|
Sales
|
768.1
|
590.5
|
30%
|
|
Net profit
|
223.1
|
119.7
|
86%
|
|
Adjusted net profit
|
207.4
|
116.2
|
78%
|
|
EPS (Rmb cts)
|
14.0
|
7.6
|
84%
|
Source: Company
If not FY11 results, is it due to a weak 1QFY12 results?
China Animal released its 1QFY12 results on 30 Apr 12 after the market close. Despite a 31% jump in revenue y/y, net profit dropped 34%. (See Table 2). However, if we exclude the gain in fair value of derivative financial instruments and amortised interest expense relating to the convertible bonds, adjusted net profit would have grown by 12% y/y. It is also noteworthy that for 1QFY12, amortization expenses pertaining to the production technology rights for the animal FMD vaccines, which commenced in March 2011 amounted to RMB11.5 million in 1Q2012, compared to only RMB3.8 million in 1Q2011. Thus, if we actually compare “apple to apple”, adjusted net profit could have been higher.
Table 2: 1QFY12 results snapshot
|
Figures (RMB m)
|
1QFY12
|
1QFY11
|
% chg
|
|
Sales
|
171.6
|
131.3
|
31%
|
|
Net Profit
|
36.7
|
55.3
|
-34%
|
|
Adjusted Net Profit*
|
39.1
|
35.0
|
12%
|
Source: Company
How about its prospects?
It is true that CAL has disappointed the market previously as their sales traction in the FMD vaccines is slower than expected. However, going forward, sales for the FMD seem to be on an uptrend (albeit from a low base), with a potential recovery in margins, as it slowly gains economies of scale. (FMD has not enjoyed economies of scale yet in 1QFY12).
With reference to Table 3, both PRRS and FMD vaccines have increased relative to Aug and Feb 2011 tenders. In fact, it is noteworthy that CAL was able to procure sales for its animal FMD vaccines to 16 provinces and municipalities in Feb 2012, compared to 10 in Aug 2011 tender.
Table 3: Semi-annual bidding tenders
|
Tenders (Rmb m)
|
Feb-12
|
Aug-11
|
Feb-11
|
|
Swine fever
|
25
|
25
|
30
|
|
PRRS
|
80
|
50
|
60
|
|
FMD
|
60
|
10
|
0
|
Source: Company
Furthermore, according to previous results announcements, CAL remains on the quest to export the animal FMD vaccines overseas through joint ventures or OEM arrangement. If this materializes, it should be rather significant in terms of quantum and margins.
Valuations vs peers
With reference to Table 4, CAL trades at 7.4x FY12F PE as compared to the industry average of around 18.4x. ROE is also above the industry average of 13%. Notwithstanding the above, as CAL has disappointed the market before, it may need a few quarters of strong results and good FMD traction (to convince the investment community) before it can be re-rated.
Table 4: CAL’s valuations vis-a-vis its peers
|
Short Name
|
Cur
|
Last Px
|
Analyst TP
|
Change in TP
|
1 Yr high
|
1 Yr low
|
Adj Mkt Cap (S$m)
|
FY11 PE
|
FY12F PE
|
ROE (%)
|
Fwd Div Yield (%)
|
|
China Animal
|
SGD
|
0.22
|
0.35
|
56.8
|
0.31
|
0.21
|
350.1
|
8.0
|
7.4
|
22.6
|
2.8
|
|
Tongwei Co-A
|
CNY
|
5.78
|
NA
|
NA
|
9.29
|
4.57
|
760.8
|
53.7
|
20.8
|
6.0
|
NA
|
|
Jiangxi Zhengb-A
|
CNY
|
10.25
|
NA
|
NA
|
13.10
|
7.20
|
861.4
|
29.3
|
19.9
|
12.2
|
NA
|
|
Xinjiang Tian -A
|
CNY
|
9.36
|
14.99
|
60.1
|
15.58
|
8.42
|
568.2
|
34.0
|
18.9
|
7.1
|
NA
|
|
China Animal-A
|
CNY
|
16.84
|
NA
|
NA
|
26.98
|
15.45
|
1,290.8
|
14.6
|
14.1
|
26.7
|
NA
|
|
|
|
|
|
|
|
|
|
|
|
|
|
|
|
|
|
|
|
|
|
|
|
|
|
|
|
Average ex China Animal
|
|
|
|
|
32.9
|
18.4
|
13.0
|
NA
|
|||
Source: Bloomberg (30 Apr 12)
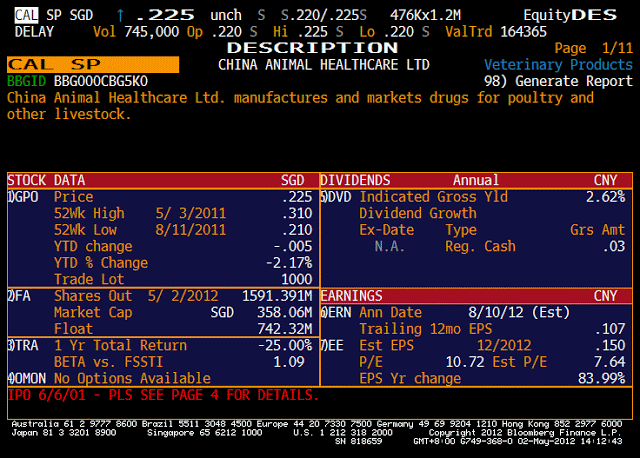
Annex A – Description of China Animal
Source: Bloomberg (2 May 12)
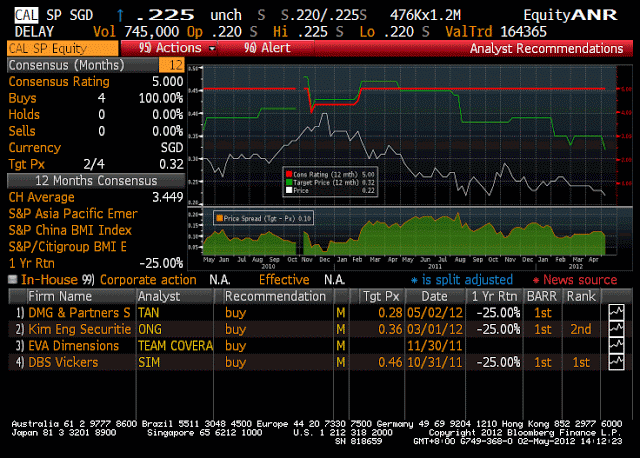
Annex B – Analysts’ target prices
Source: Bloomberg (2 May 12)
DisclaimerThe information contained herein is the writer’s personal opinion and is provided to you for information only and is not intended to or nor will it create/induce the creation of any binding legal relations. The information or opinions provided herein do not constitute an investment advice, an offer or solicitation to subscribe for, purchase or sell the investment product(s) mentioned herein. It does not have any regard to your specific investment objectives, financial situation and any of your particular needs. Accordingly, no warranty whatsoever is given and no liability whatsoever is accepted for any loss arising whether directly or indirectly as a result of this information. Investments are subject to investment risks including possible loss of the principal amount invested. The value of the product and the income from them may fall as well as rise. You may wish to seek advice from an independent financial adviser before making a commitment to purchase or invest in the investment product(s) mentioned herein. In the event that you choose not to do so, you should consider whether the investment product(s) mentioned herein are suitable for you. The writer will not, in any event, be liable to you for any direct/indirect or any other damages of any kind arising from or in connection with your reliance on any information in and/or materials appended herein. The information and/or materials are provided “as is” without warranty of any kind, either express or implied. In particular, no warranty regarding accuracy or fitness for a purpose is given in connection with such information and materials.
[1] Readers who are not familiar with CAL can refer to Annexes A & B for more information.


Keep on writing, great job!