STI
dropped 107 points for the week of 7-11 May. It sank another 104 points or 3.5%
to 2,779 last week. All in, it had slumped 211 points for the past fortnight.
Since 3 May, HSI and STI had tumbled 2,298 points (12.1%) and 222 points (8.0%)
respectively. If we compare the intraday high of 3 May vs the intraday low of
18 May, the decline for HSI and STI would have been a steeper 2,635 points
(14.1%) and 251 points (9.1%) respectively.
Despite
the market drop, some interesting stocks to take note based on my personal
observation and technical analysis are as follows:
the market drop, some interesting stocks to take note based on my personal
observation and technical analysis are as follows:
1.
China
Animal Healthcare Ltd (“CAL”)
China
Animal Healthcare Ltd (“CAL”)
Notwithstanding
the 7.4% drop in STI since 3 May, CAL has notched an impressive gain of 9.3%
over the same period (See Table 1).
On last Friday, when STI gapped down 39 points (1.4%), CAL actually gapped up
$0.005 (2.1%) to $0.240 and even went to a high of $0.245 before closing
unchanged at $0.235. 9.2m shares changed hands which was approximately a 3
month high volume. It is noteworthy that 7.9m shares (i.e. 86% of the
transactions) were done at $0.240; 1.2m shares were executed at $0.245 with the
balance 71,000 shares executed at $0.235.
Table 1: Comparison of CAL vs STI price
performance since 3 May
performance since 3 May
|
Indices
|
3 May close
|
18 May close
|
chg
|
% chg
|
|
China Animal
|
0.215
|
0.235
|
+0.020
|
+9.3%
|
|
STI
|
3,001
|
2,779
|
-222
|
-7.4%
|
Source: Ernest’s compilations
Based
on Chart 1 below, CAL seems to be in
the midst of forming a bottom pattern. In addition, the recent move above most
of the moving averages with volume seems to bode well for the stock. Key
resistances are at $0.245 – 0.250 and $0.260. A cluster of supports is at
$0.225 – 0.235. Ave analyst target price
is around $0.320.
Chart 1: CAL’s price chart
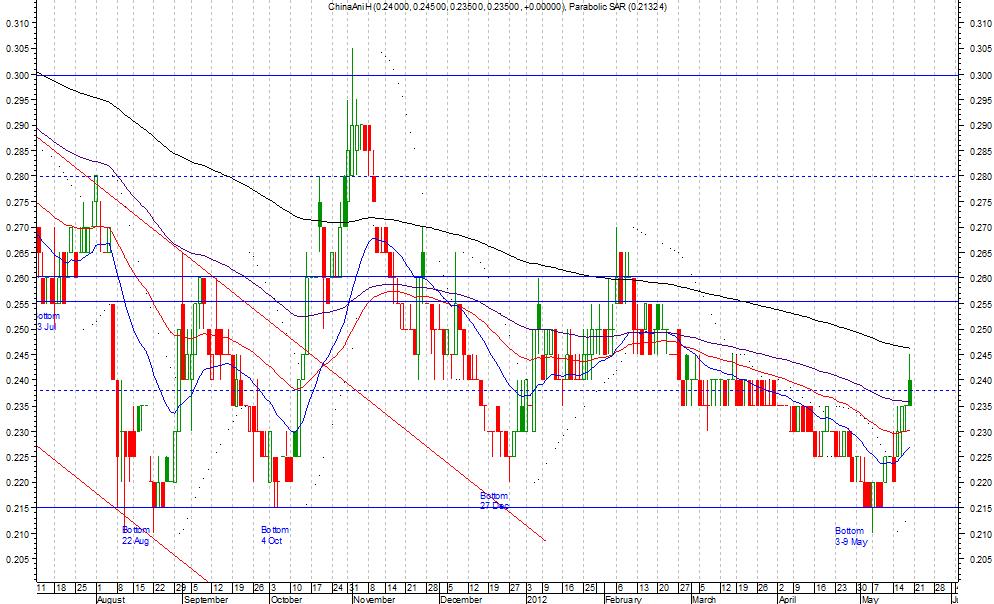
Source: Metastock
2.
Olam
International Limited
Olam
International Limited
Olam
has significantly underperformed the STI by tumbling $0.57 or 25% since 3 May.
This was mainly attributable to its weak results announced on 15 May which
promptly caused the stock to gap down on 16 May. Having dropped 25% since 3
May, Olam’s RSI was 10.4 on Friday, an all time low, since its listing in 2005.
Money Flow Index (“MFI”)[1] was
also at an all time low of 5.7. Thus, it is likely that Olam may see a near term bottom
soon.
Supports
are at 1.690-1.710 / 1.675 / 1.655 / 1.60. However, given the all time low
readings of RSI and MFI, it is technically unlikely to fall below 1.675 in the
near term. Ave analyst target price is around $2.56.
are at 1.690-1.710 / 1.675 / 1.655 / 1.60. However, given the all time low
readings of RSI and MFI, it is technically unlikely to fall below 1.675 in the
near term. Ave analyst target price is around $2.56.
Chart 2: Olam’s price chart
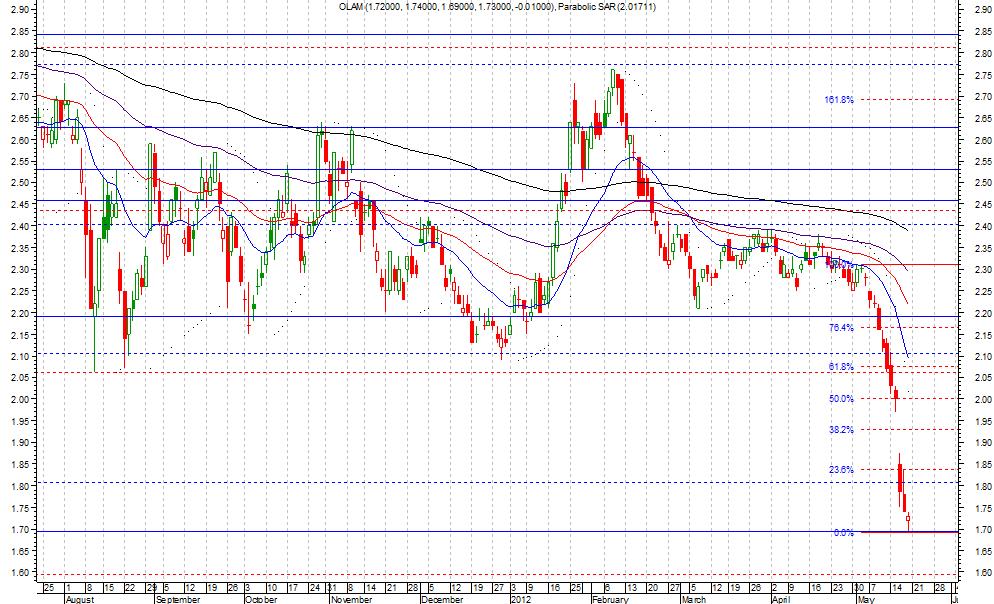
Source: Metastock
3.
Wilmar
International Limited
Wilmar
International Limited
Like Olam, Wilmar has also
underperformed the STI by sinking $1.17 or 24% since 3 May. The main
contributing factor was its lackluster results announced on 10 May morning
which caused the stock to gap down on the same day. Wilmar’s RSI was at 13.2
last Friday (Its RSI was actually lower than that as the share price dipped to
an intraday low of $3.71 last Friday.). The RSI of 13.2 was a 2 year low
reading since 20 May 2010. All time low RSI was 10.9 in Oct 2000. Suffice to
say that Wilmar has seldom dipped below 13.2 since its listing in 2000. MFI was
at 8.2 vs the all time low of 0. Although both RSI and MFI are not at an all
time low, they are at sufficiently low levels for traders to take note of.
However, traders would have to take note that Wilmar’s beta is around 1 which
indicates that it may not significantly rebound more than the STI if STI
rebounds.
Supports are at 3.71 / 3.68 / 3.60. Resistances
at 3.87 / 4.02 / 4.20. Ave analyst target price is around $4.78.
at 3.87 / 4.02 / 4.20. Ave analyst target price is around $4.78.
Chart 3: Wilmar’s price chart
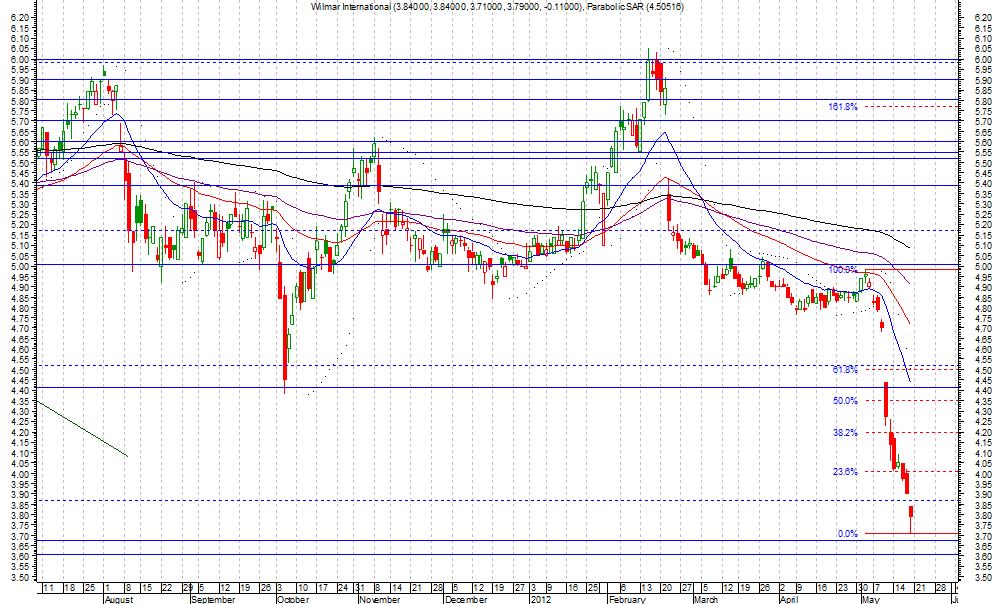
Source: Metastock
Please
note that the above is my personal observation cum opinion and may not cater to
your specific risk profile etc. It is extremely important to bear in mind that the market outlook OR /
& technical outlook on stocks are never static. It can change suddenly if
there are sudden big events unfolding from the market – some events can happen
as quickly as overnight.
Disclaimer
The information contained herein is the writer’s
personal opinion and is provided to you for information only and is not
intended to or nor will it create/induce the creation of any binding legal
relations. The information or opinions provided herein do not constitute an
investment advice, an offer or solicitation to subscribe for, purchase or sell
the investment product(s) mentioned herein. It does not have any regard to your
specific investment objectives, financial situation and any of your particular
needs. Accordingly, no warranty whatsoever is given and no liability whatsoever
is accepted for any loss arising whether directly or indirectly as a result of
this information. Investments are subject to investment risks including
possible loss of the principal amount invested. The value of the product and
the income from them may fall as well as rise. You may wish to seek advice from
an independent financial adviser before making a commitment to purchase or
invest in the investment product(s) mentioned herein. In the event that you
choose not to do so, you should consider whether the investment product(s)
mentioned herein are suitable for you. The writer will not, in any event, be
liable to you for any direct/indirect or any other damages of any kind arising
from or in connection with your reliance on any information in and/or materials
appended herein. The information and/or materials are provided “as is” without
warranty of any kind, either express or implied. In particular, no warranty
regarding accuracy or fitness for a purpose is given in connection with such
information and materials.
[1] MFI measures the money flowing in and out of a security.
MFI is range bound between 100 and 0. Generally, market tops occur when MFI
> 80 and market bottom when MFI < 20.
MFI is range bound between 100 and 0. Generally, market tops occur when MFI
> 80 and market bottom when MFI < 20.