Dear all,
Asian stocks have seen some pressure for the past two weeks on worries over rate hike in the U.S., weakness in the commodities markets and the slowing growth in China.
Here are the technical analyses on the charts.
S&P500 chart
Two weeks ago, I mentioned that S&P500 may test the recent high of 2,135. It tested 2,133 before profit taking set in. S&P500 closed at 2,078 last Fri.
Since 5 Feb 2015, S&P500 has traded within a tight range of 2,040 – 2,135. Based on Chart 1 below, S&P500 seems to be reaching the lower end of the range. Critical support is seen at 2,040 – 2,061. ADX remains low at 14.6 which indicates a lack of trend. Thus, given the available information, S&P500 is likely to trade within the range 2,040 – 2,135 in the next two weeks. Nevertheless, a breakdown below 2,040 is bearish and points to an eventual technical target of 1,945.
Near term supports are around 2,061 / 2,040 – 2,045.
Near term resistances are around 2,091 / 2,097 – 2,100.
Chart 1: S&P500 tested 2,133 before profit taking set in

Source: CIMB chart as of 7 Aug 2015
Hang Seng chart
Two weeks ago, I wrote that Hang Seng continued to be entrenched in a downtrend but it is unlikely to revisit the low of 22,837 on 8 Jul 2015 on pullbacks, barring any large market shock. Hang Seng closed at 24,553 last Fri.
For the past two weeks, Hang Seng has been trading within the range of 24,141 – 24,947. Given the chart’s development for the past two weeks, in order for the chart to negate its bearish feel, Hang Seng should clear 24,900 – 25,970 to negate the bearish tint. (See Chart 2 below). Notwithstanding the downtrend, I reiterate that it is unlikely that Hang Seng will revisit the low of 22,837 on 8 Jul 2015.
Near term supports are around 24,141 / 23,715.
Near term resistances: 24,900 / 25,317.
Chart 2: Hang Seng – unlikely to revisit the low of 22,837

Source: CIMB chart as of 7 Aug 2015
STI chart
Two weeks ago, I wrote that the odds for a bullish upside breakout above 3,359 were higher. STI indeed broke out and touched an intraday high of 3,384 on 21 Jul 2015 before weakening and closing at 3,197 on last Fri.
Based on Chart 3 below, STI broke down below its tight range of 3,291 – 3,359 since 4 Jun 2015. A breakdown points to an eventual technical target of around 3,223. This level was already reached. If I view the chart by looking at the price movement between 9 Jul to 30 Jul 2015, STI also broke down from the range of 3,250 – 3,377 which points to an eventual technical target of 3,123.
RSI touched around 27 on 3 – 5 Aug 2015 before closing at 29 on 6 Aug. STI seemed to have formed a potential bullish hammer on 6 Aug but we need to see follow through buying in order to confirm the formation. Notwithstanding this, STI is currently entrenched in a downtrend.
Near term supports are at 3,150 / 3,123
Near term resistances are at 3,250 / 3,272
Chart 3: STI – needs to see follow through buying to confirm a hammer formation
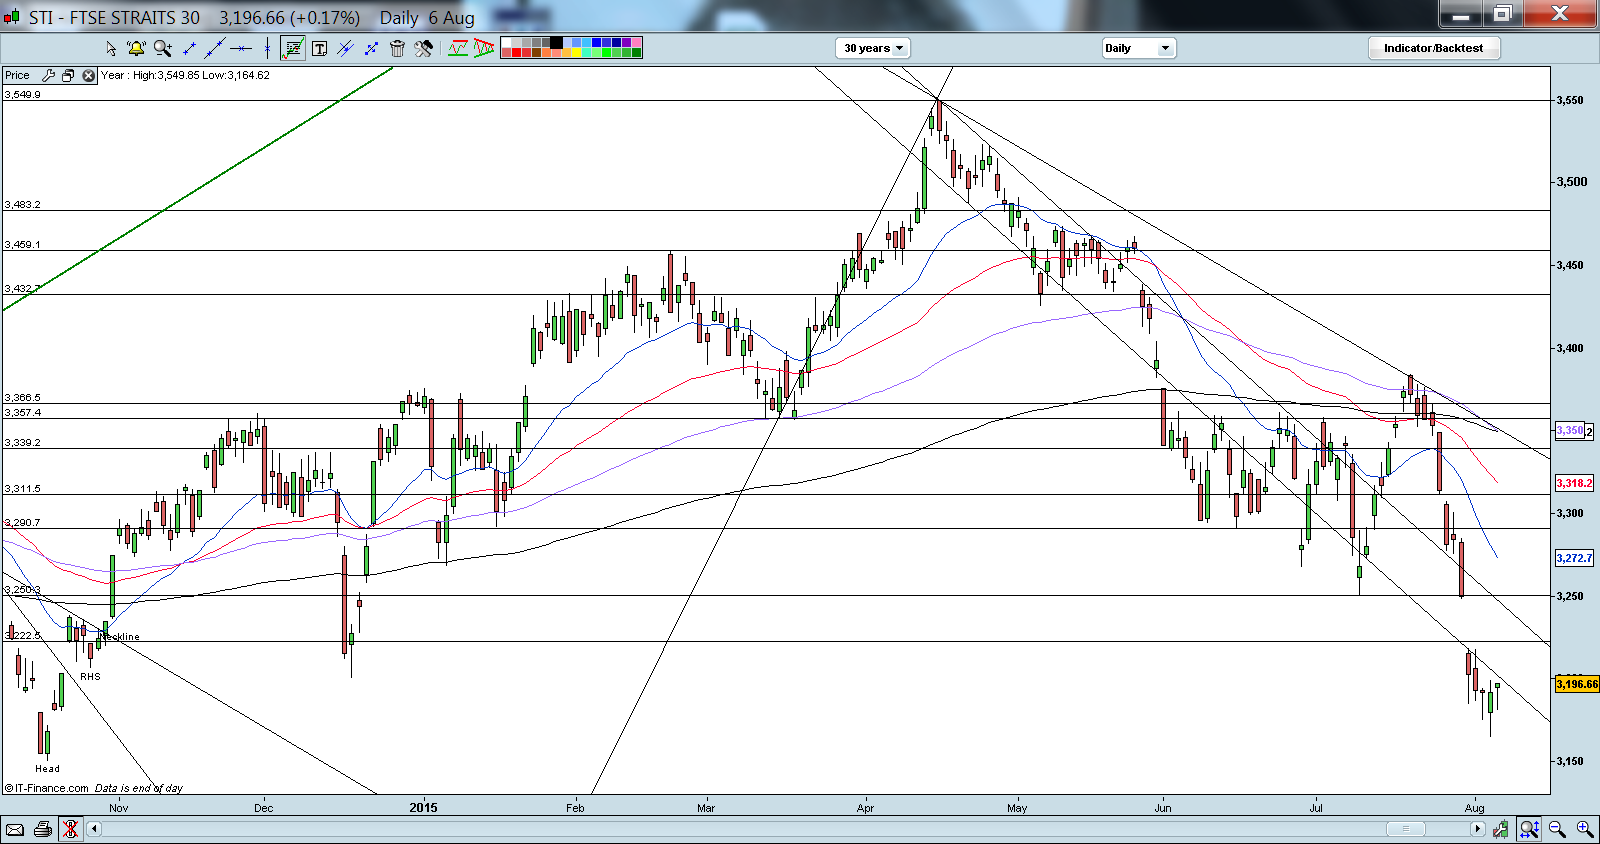
Source: CIMB chart as of 6 Aug 2015
FSTS chart
Two weeks ago, I wrote that FSTS break below 471 was a negative development and it was important for FSTS to regain 471 quickly and not let 471 level to become a formidable resistance. Unfortunately, although FSTS went above 471, it failed to hold above 471 and closed at 448 on last Fri.
FSTS continues to be entrenched in a strong downtrend by closing at a three year low. After the plunge on 3 Aug 2015, it has spent three days trading in a tight range 446 – 449. Hopefully this can alleviate the excess selling pressure. RSI closed at oversold level of 22.0. It is noteworthy that the recent significant low of RSI was 17.8 on 19 Mar 2015. The all time RSI oversold level for FSTS was around 10.0 (See Chart 4 below).
Near term supports are at 439 – 440 / 430 – 432
Near term resistances are at 461 / 471 – 473
Chart 4: FSTS – Three year low

Source: CIMB chart as of 6 Aug 2015
Disclaimer
The above writeup on the markets is done on an ad-hoc basis (depending on whether I have enough time). Please refer to the disclaimer here http://ernest15percent.com/index.php/disclaimer/.
Wow, wonderful weblog format! How long have you been running a blog for?
you made blogging glance easy. The full glance of
your site is magnificent, as neatly as the content
material! You can see similar here sklep internetowy