Dear all,
Global stocks slumped last week. Stocks look to open sharply lower with the U.S. markets tumbling 3% overnight.
Based on the charts’ analyses below, Hang Seng, STI and FSTS may see some technical rebound in the near term. Nevertheless, all three indices are still entrenched in a strong downtrend. The potential near term technical rebound may yield opportunities for nimble traders who are looking at small potential profits as we are still in a downtrend. I have compiled a list of stocks which are trading at or near all time oversold levels with other key data such as NAV; average analyst target prices; supports and resistances etc for my clients. I will send out later.
S&P500 chart
Two weeks ago, I mentioned that if S&P500 breaks below 2040, it is bearish and points to an eventual technical target of 1,945.
S&P500 broke below 1940 on 20 Aug and closed at 1,971 on 21 Aug, Fri. Based on Chart 1 below, S&P500 should see strong near term support at 1,940 – 1,945. Near term resistance are at 1,980 / 2,015. RSI closed at 24.8 last Fri. Although this level is not at extreme oversold levels, it is the lowest last seen on 18 May 2012.
Chart 1: S&P500 near term supports at 1,940 – 1,945
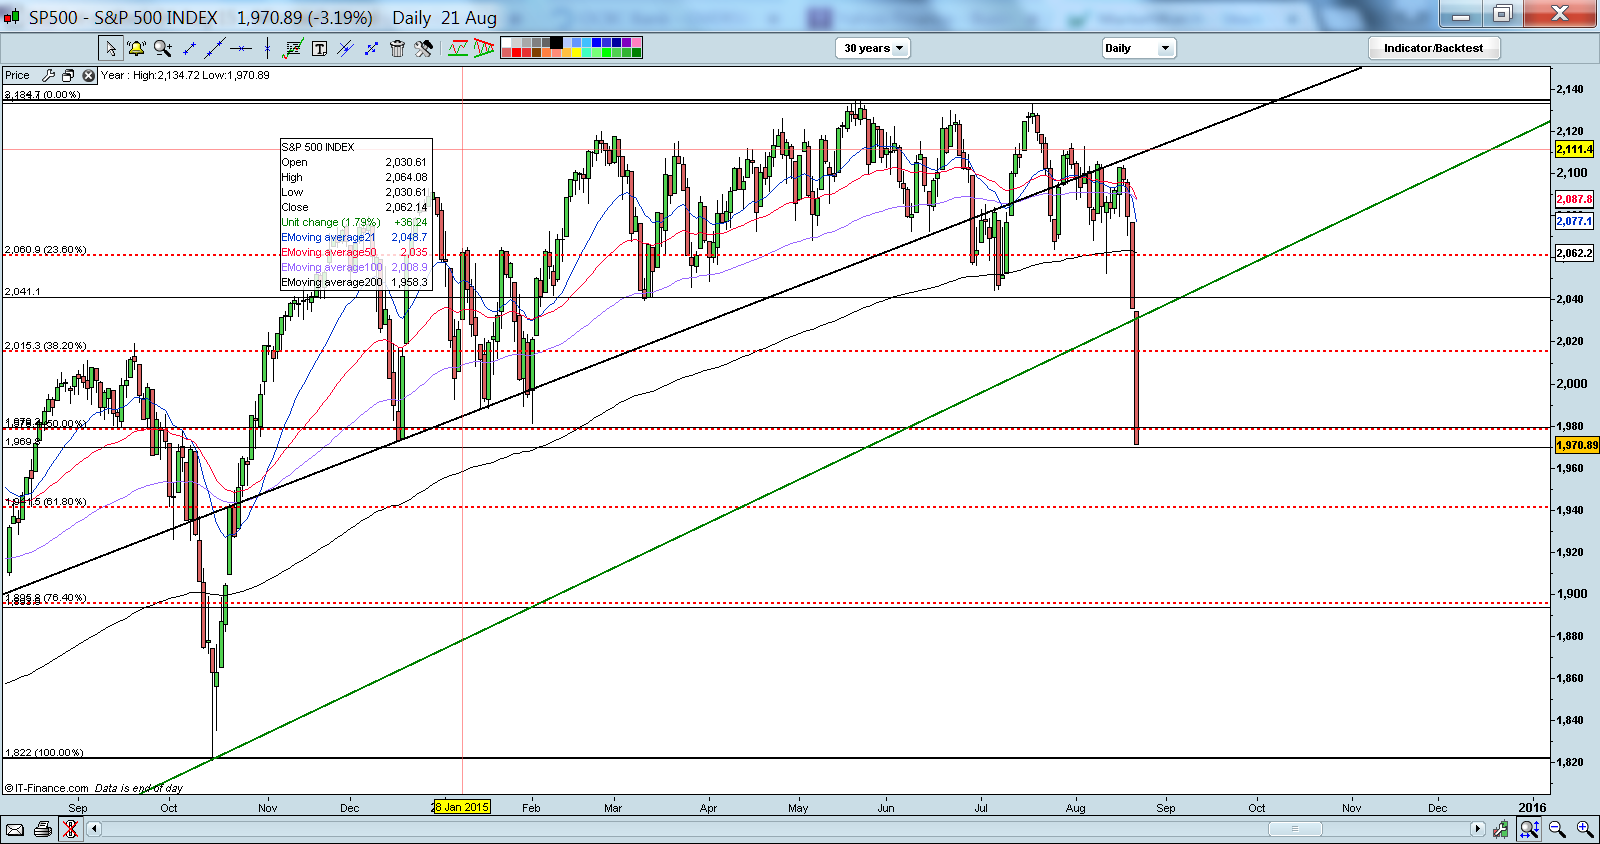
Source: CIMB chart as of 21 Aug 2015
Hang Seng chart
Two weeks ago, I wrote that Hang Seng continued to be entrenched in a downtrend but it is unlikely to revisit the low of 22,837 on 8 Jul 2015 on pullbacks, barring any large market shock.
Unfortunately, with the weakness in the global markets and especially China, Hang Seng broke below 22,837 on 20 Aug 2015 and closed at 22,410 on 21 Aug, Fri. RSI closed at 20.6 on last Fri. Since Jan 1988, the lowest RSI was around 16.0. Since 1998, the lowest RSI was around 18.5. Thus, it is likely that Hang Seng may see a technical rebound in the near term. Despite the potential technical rebound, Hang Seng is still entrenched in a strong downtrend. (See Chart 2 below)
Near term supports are around 21,864 / 21,640 / 21,500
Near term resistances: 22,400 / 22,600.
Chart 2: Hang Seng – oversold – may see a technical rebound in the near term

Source: CIMB chart as of 21 Aug 2015
STI chart
Two weeks ago, I wrote that STI is still in a downtrend. Although it seemed to have formed a potential bullish hammer on 6 Aug, we need to see follow through buying in order to confirm the formation.
Based on Chart 3 below, there is no follow through buying and STI touched levels last seen in Nov 2012. STI closed at 2,971 last Fri. RSI closed at 19.4 last Fri. Between Sep 2001 to now, the lowest level that RSI touched was 17.3. Thus, it is likely that STI may see a technical rebound in the near term. Despite the potential technical rebound, STI is still entrenched in a strong downtrend. (See Chart 2 below)
Near term supports are at 2,932 / 2,915 / 2,900
Near term resistances are at 2,980 / 3,001
Chart 3: STI – oversold – may see a technical rebound in the near term

Source: CIMB chart as of 21 Aug 2015
FSTS chart
Two weeks ago, I wrote that FSTS’ recent significant low of RSI was 17.8 on 19 Mar 2015. The all time RSI oversold level for FSTS was around 10.0. RSI closed at all time low at 6.2 on last Fri. FSTS closed at 397, near the low last seen on Oct 2011.
Together with STI, the extreme oversold pressure on FSTS should prompt a near term technical rebound. However, FSTS is still entrenched in a strong downtrend. (See Chart 4 below).
Near term supports are at 386 / 377
Near term resistances are at 403 – 405 / 415
Chart 4: FSTS – RSI at all time low of 6.2
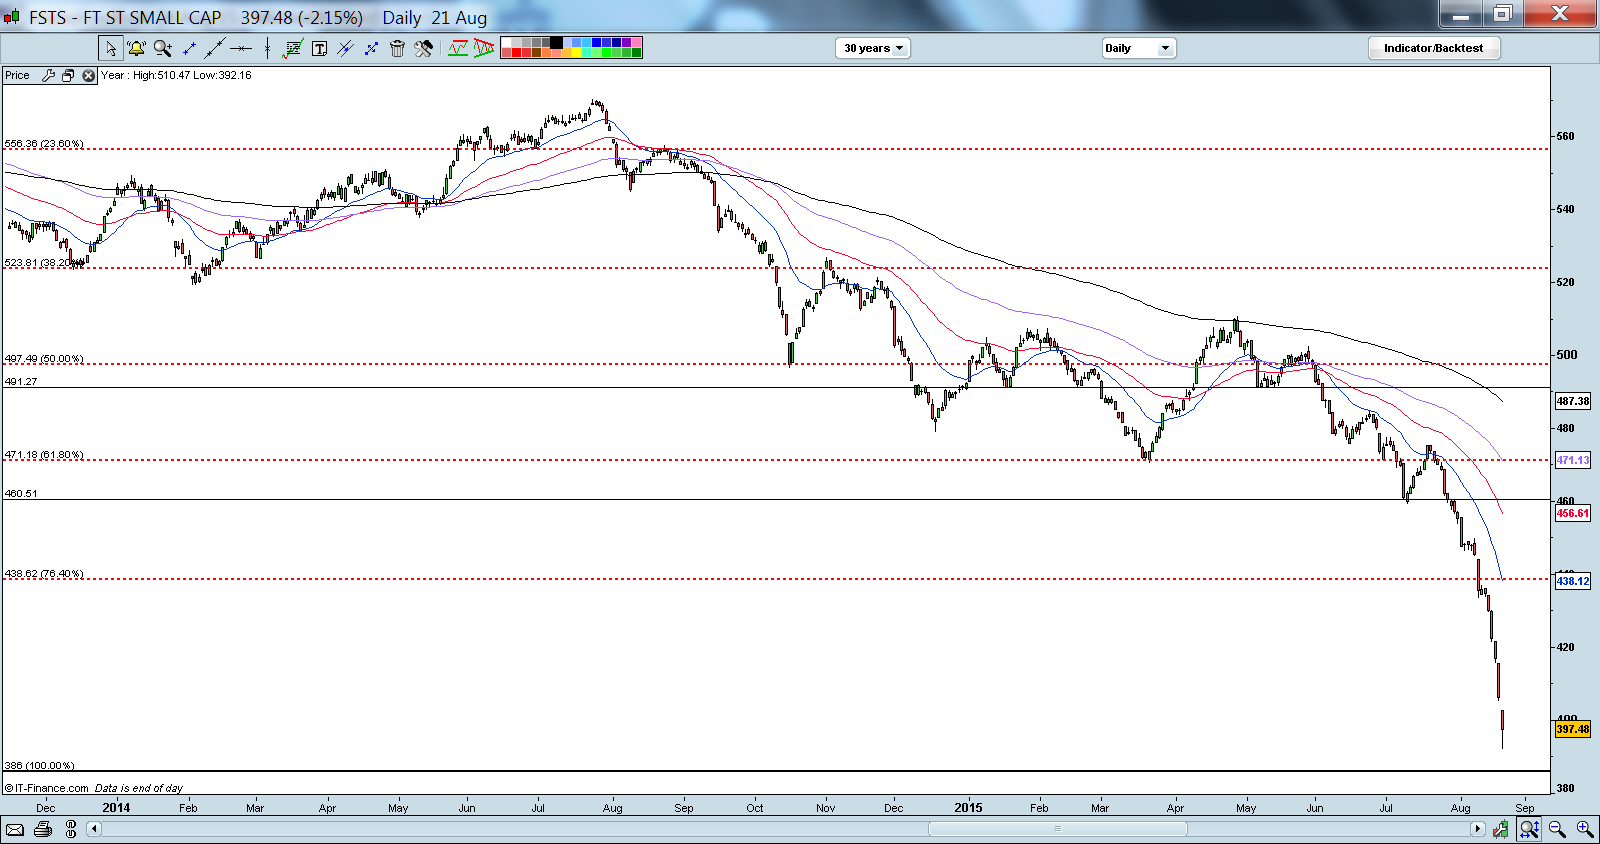
Source: CIMB chart as of 21 Aug 2015
Disclaimer
The above writeup on the markets is done on an ad-hoc basis (depending on whether I have enough time). Please refer to the disclaimer here http://ernest15percent.com/index.php/disclaimer/.
I loved your blog post.Really looking forward to read more. Want more.