Dear all,
Last week was a tumultuous week where STI fell to a three year low of 2,808 on 25 Aug, Tues before it recovered 148 points to close at 2956 on 28 Aug, Fri. As per my market update written on 23 Aug, Sun and subsequent emails to my clients on 24 Aug, Mon afternoon and 25 Aug early morning, STI was all time oversold and there were trading (long) opportunities for the nimble traders. All the stocks in my *list of extremely oversold stocks generated positive returns with Ezion, Croesus and Innovalues which posted between 15% – 45% potential upside.
*I have compiled a list of stocks which were trading at or near all time oversold levels with other key data such as NAV; average analyst target prices; supports and resistances etc for my clients which I have sent out on 23 Aug Sun and updated on 25 Aug, Tues early morning. For those readers who are on my “readers’ mailing list”, they also got my list, albeit a few days later.
Below are my charts’ analyses.
S&P500 chart
Last week, I mentioned that S&P500 should find near term support at 1,940 – 1,945. However, S&P500 plunged 103 points, or 5.2% from 1,971 on 21 Aug to 1,868 on 25 Aug, Tues within two days. It subsequently rebounded 121 points, or 6.5% to close 1,989 on 28 Aug, Fri.
Based on Chart 1 below, S&P500 is still entrenched in a downtrend, exacerbated with the formation of death crosses. With the recent rebound, S&P500 is no longer oversold. In my opinion, this recent rebound is unlikely to be a reversal and is likely to be a technical rebound in a downtrend.
Near term supports: 1,969 / 1,940.
Near term resistances: 2,000 / 2,026 – 2,031.
Chart 1: Unlikely to be a downtrend reversal but more of a technical rebound

Source: CIMB chart as of 28 Aug 2015
Hang Seng chart
Hang Seng’s RSI touched 15 on 24 Aug 2015 which was lower than Jan 1988. Oversold pressures triggered a technical rebound which sent Hang Seng rallying 1,559 points or 7.5% from an intraday low of 20,865 on 25 Aug 2015 to an intraday high of 22,424 on 28 Aug before closing at 21,612 on last Fri. Amid the recent rebound, Hang Seng is no longer oversold. Notwithstanding the potential technical rebound, Hang Seng is still entrenched in a strong downtrend. (See Chart 2 below)
Near term supports are around 20,865 – 20,933 / 20,500
Near term resistances: 22,400 / 22,680.
Chart 2: Hang Seng – still entrenched in a strong downtrend
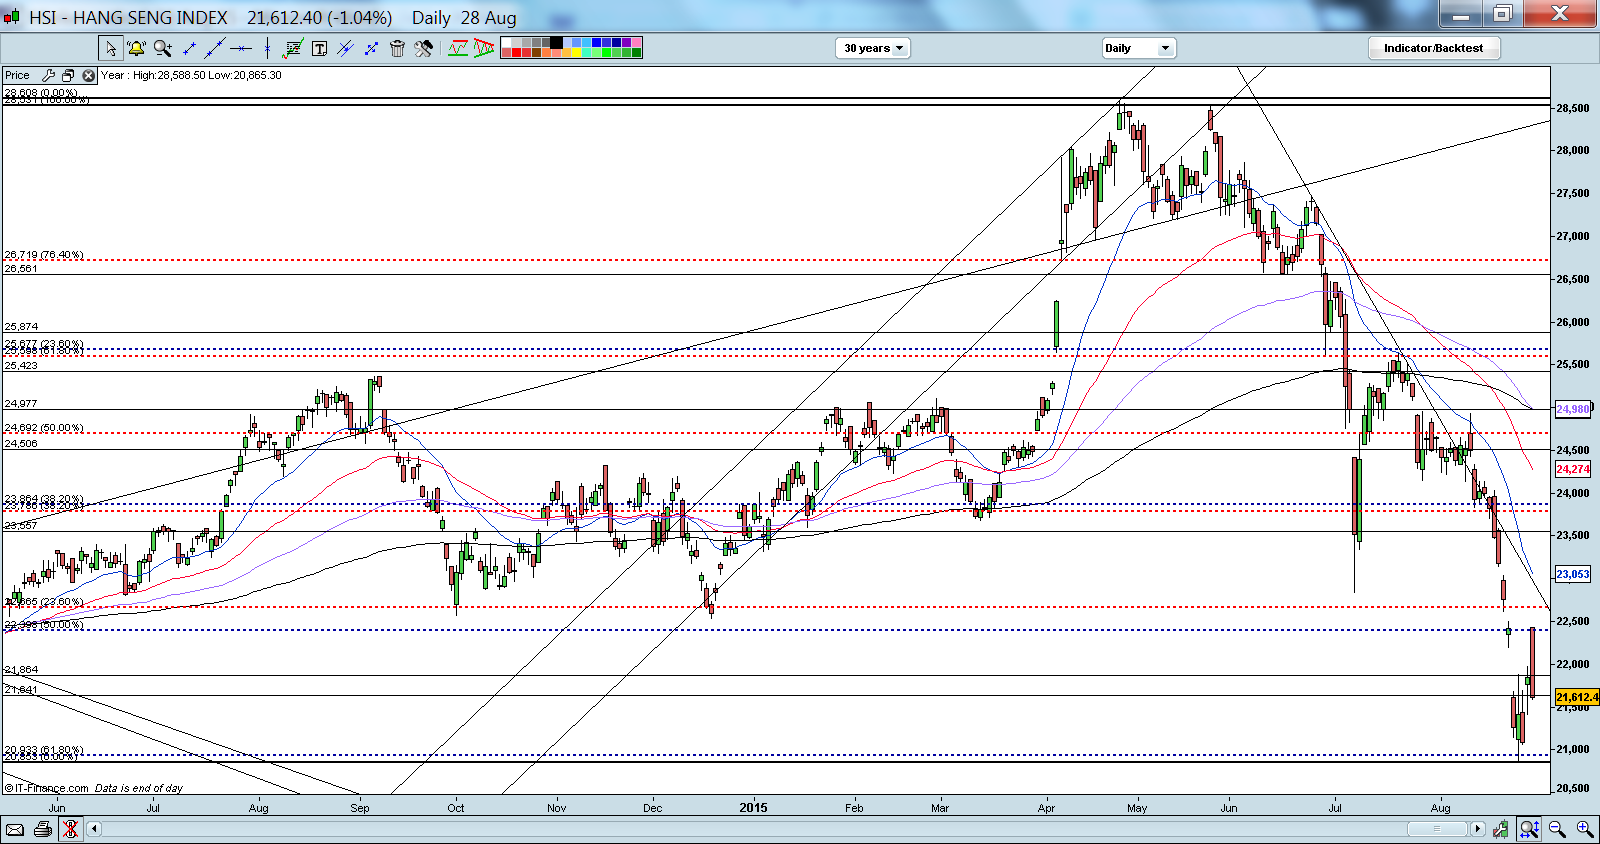
Source: CIMB chart as of 28 Aug 2015
STI chart
STI fell to a three year low of 2,808 on 25 Aug 2015. It subsequently jumped to an intraday high of 2,999 on 28 Aug (near to my previously mentioned resistance 3,001) before profit taking set in and it closed lower at 2,956 on 28 Aug, Fri. Based on Chart 3 below, it is noteworthy that STI continues to be entrenched in a strong downtrend. It is no longer oversold on the back of a recent technical bounce.
Near term supports are at 2,914 / 2,843 – 2,847
Near term resistances are at 3,001 / 3,028 – 3,035
Chart 3: STI – no longer oversold, still in a strong downtrend
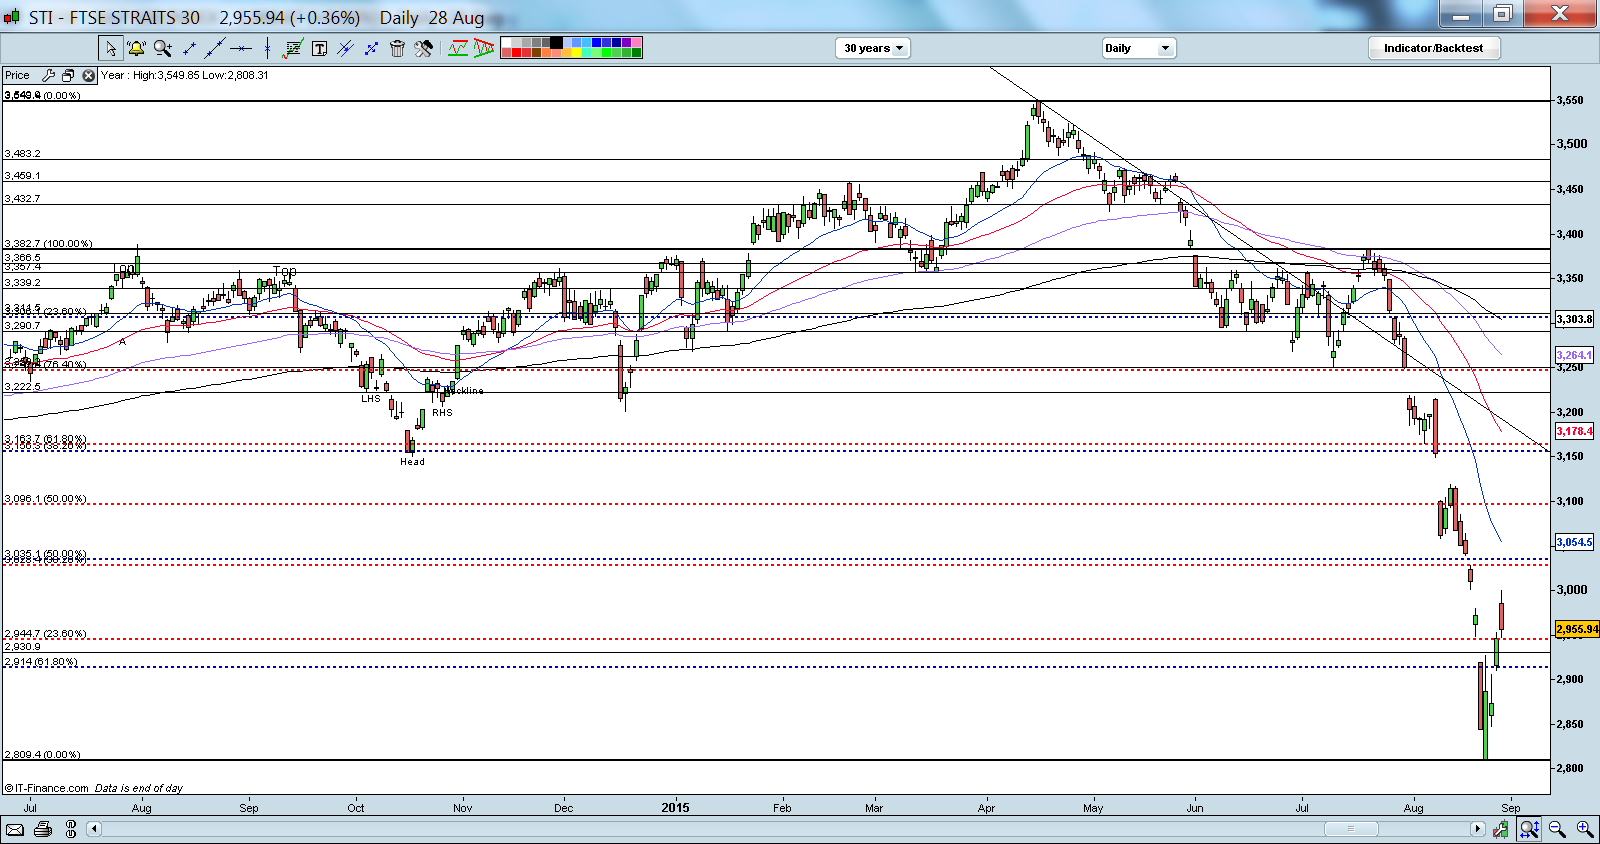
Source: CIMB chart as of 28 Aug 2015
FSTS chart
In line with my expectations outlined last week, FSTS staged a technical rebound on oversold pressures (RSI touched 4.3 on 24 Aug, Mon) and closed 2% higher for the week at 405 (right on my previously mentioned resistance level) It is no longer oversold on the back of this relief rally. (See Chart 4 below).
Near term supports are at 401 / 386 – 389
Near term resistances are at 416 / 420
Chart 4: FSTS – No longer oversold with RSI at 36
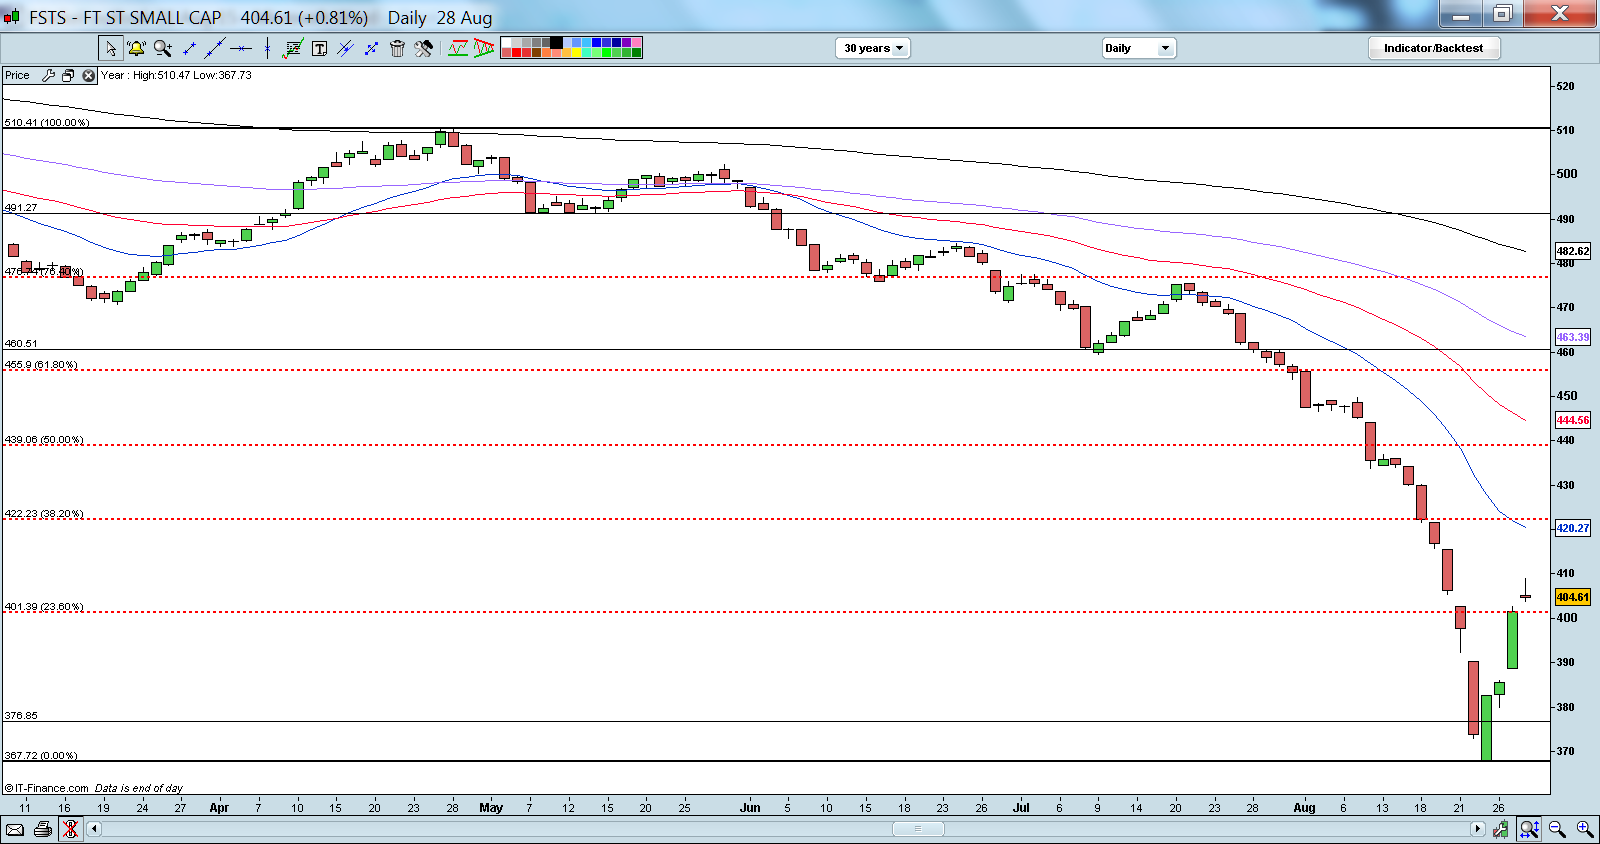
Source: CIMB chart as of 28 Aug 2015
Disclaimer
The above writeup on the markets is done on an ad-hoc basis (depending on whether I have enough time). Please refer to the disclaimer here http://ernest15percent.com/index.php/disclaimer/.