The past week has been extremely rewarding for those who have bought in the week of 28 Sep 2015 when STI slipped below 2,800. For example, the MSCI All Country World Index had its best weekly rally since 2011. Closer to home, STI jumped 9.5% from the intraday low of 2,740 on 29 Sep 2015 to close at 2,999 on 9 Oct 2015.
In retrospect, STI has performed in line with my expectations as follows:
1. In my write-up http://ernest15percent.com/index.php/2015/09/26/ernests-market-outlook-28-sep-15/ posted two weeks ago, I wrote that STI’s break below 2,843 was bearish with a measured technical target of 2,757. It hit 2,757 and touched an intraday low of 2,740 (0.6% away from my measured technical target of 2,757) but closed promptly at 2,788 on the same day.
2. In the above write-up, I also mentioned that the bearish tinge in STI’s chart would be negated if it breached 2,929. STI broke above 2,929 and touched an intraday of 3,012 on 9 Oct (up 2.8% from 2,929) before closing at 2,999.
3. In my email (which accompanied my write-up) to both my clients and my readers sent two weeks ago, I have written that based on my personal opinion, even if STI broke 2,800, the max near term downside in the worst case scenario was probably around 2,500 – 2,600. According to Bloomberg, as the average 1 year analyst target for STI was around 3,500, risk reward ratio looked favourable for investors with a long term horizon and little percentage invested to start nibbling at blue chip stocks at <=2,800. This was partly supported by valuation supports where STI traded at 1.1x P/BV, on par with that during the Eurozone Crisis.
Below are my latest chart analyses / personal opinions on the various markets.
S&P500 Index
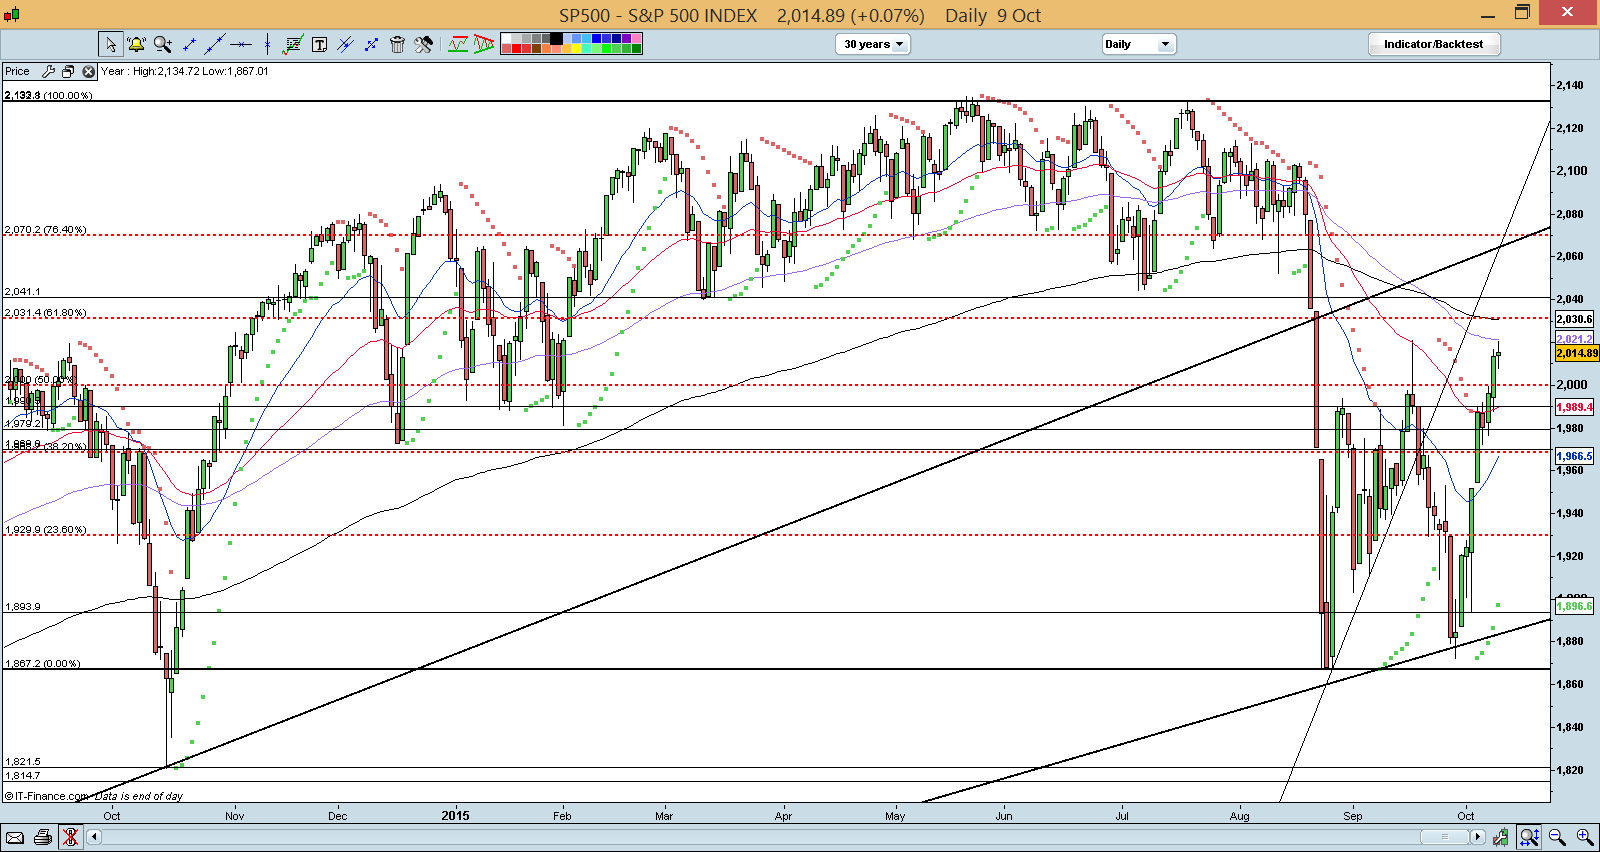
S&P500 performed in line with expectations by touching 1,872 on 29 Sep (5 points, or 0.3% away from 24 Aug low). It broke above 2,000 on 8 Oct and closed at 2,015 last Fri.
With reference to Chart 1 below, the break above 2,000 alleviates some of the bearish tinge in the chart. A possible double bottom formation may be in the making with the neckline at 2,021. However, it remains to be seen whether S&P500 can make a sustained break above 2,021. Although indicators such as RSI and MACD are strengthening, there are significant resistances at 2,021, 2,031 and 2,040 – 2,045. It is noteworthy that 2,040 – 2,045 is the lower level of the S&P500 six month plus trading range 2,040 – 2,135. (I.e. There might be investors who previously bought at 2,040 – 2,045 to trade the six month trading range before the range broke and they did not manage to cut loss.)
Notwithstanding the above, if the double bottom formation is valid, an eventual measured technical target is around 2,173. In my opinion, I prefer to wait and observe whether S&P500 retreat and test the resistance turned support region 1,990 – 2,000 before moving higher.
Near term supports: 2,000 / 1,990 / 1,980
Near term resistances: 2,021 / 2,031 / 2,040 – 2,045
Chart 1: S&P500 broke key resistance 1,990 – 2,000
Source: CIMB chart as of 9 Oct 15
Hang Seng Index
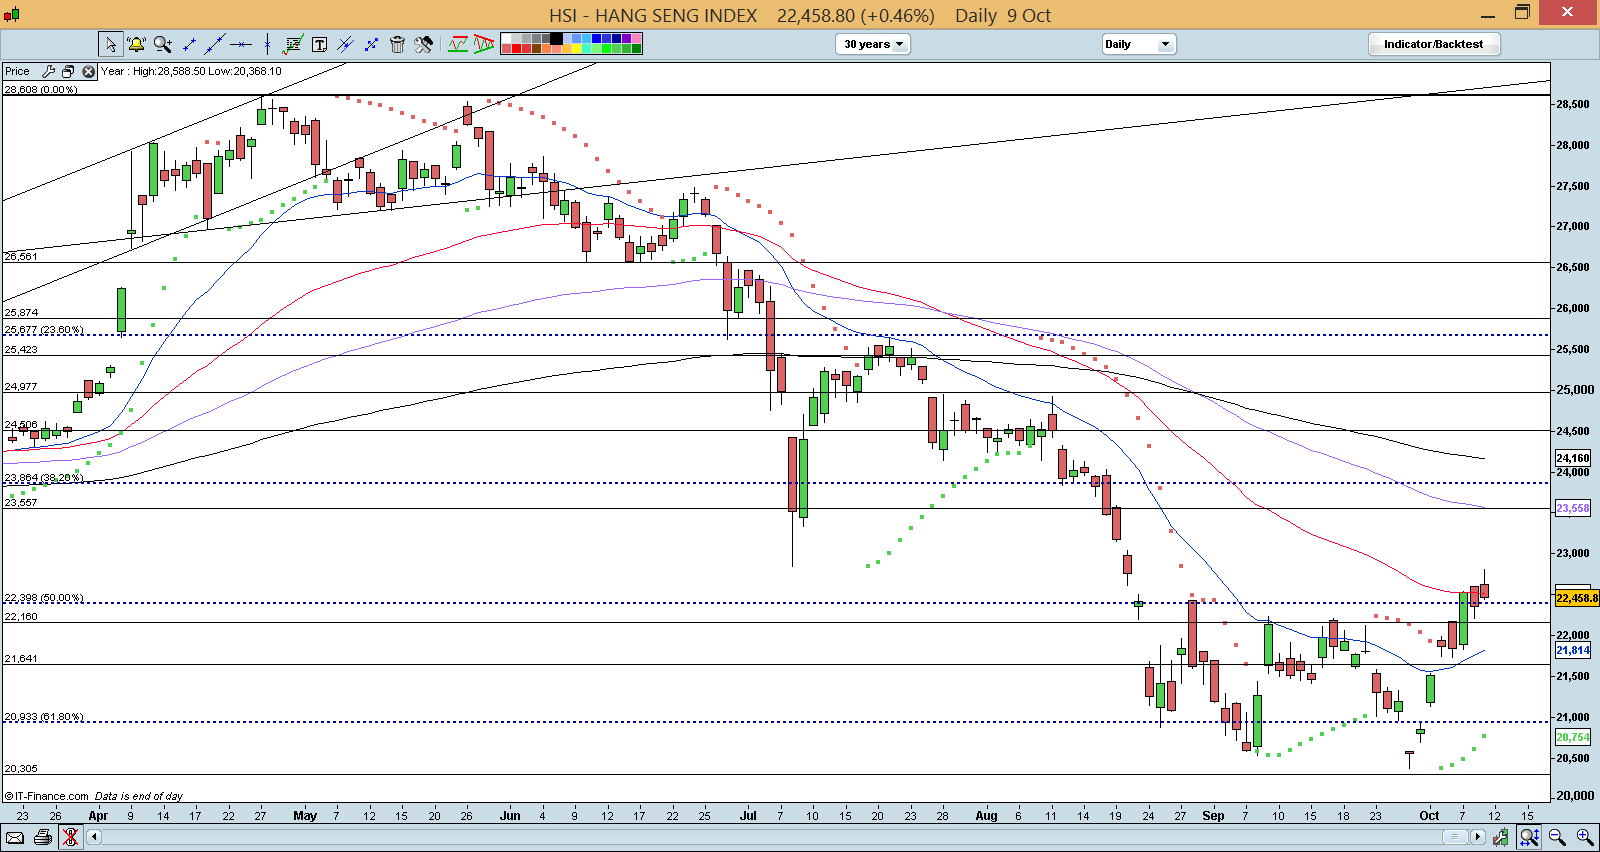
Two weeks ago, I mentioned that Hang Seng was likely to retest 20,525, the 8 Sep low. On 29 Sep, it broke below 20,525 and touched an intraday low of 20,368 before closing strongly 22,459 on 9 Oct.
With reference to Chart 2 below, Hang Seng just broke the resistance 22,160 – 22,400 on 7 Oct 2015 and closed above 22,400 for two out of the three days. Although Hang Seng seems to have broken above a potential double bottom formation with strengthening indicators such as MACD and RSI, I prefer to err on the side of caution. I prefer Hang Seng to consolidate around 21,814 – 22,400 before staging its next up-move. It is noteworthy that if the double bottom formation is valid, an eventual measured technical target is around 23,820.
Near term supports: 22,400 / 22,160 / 21,814
Near term resistances: 23,140 / 23,558 / 23,820
Chart 2: Hang Seng – potential double bottom formation?
Source: CIMB chart as of 9 Oct 15
STI Index
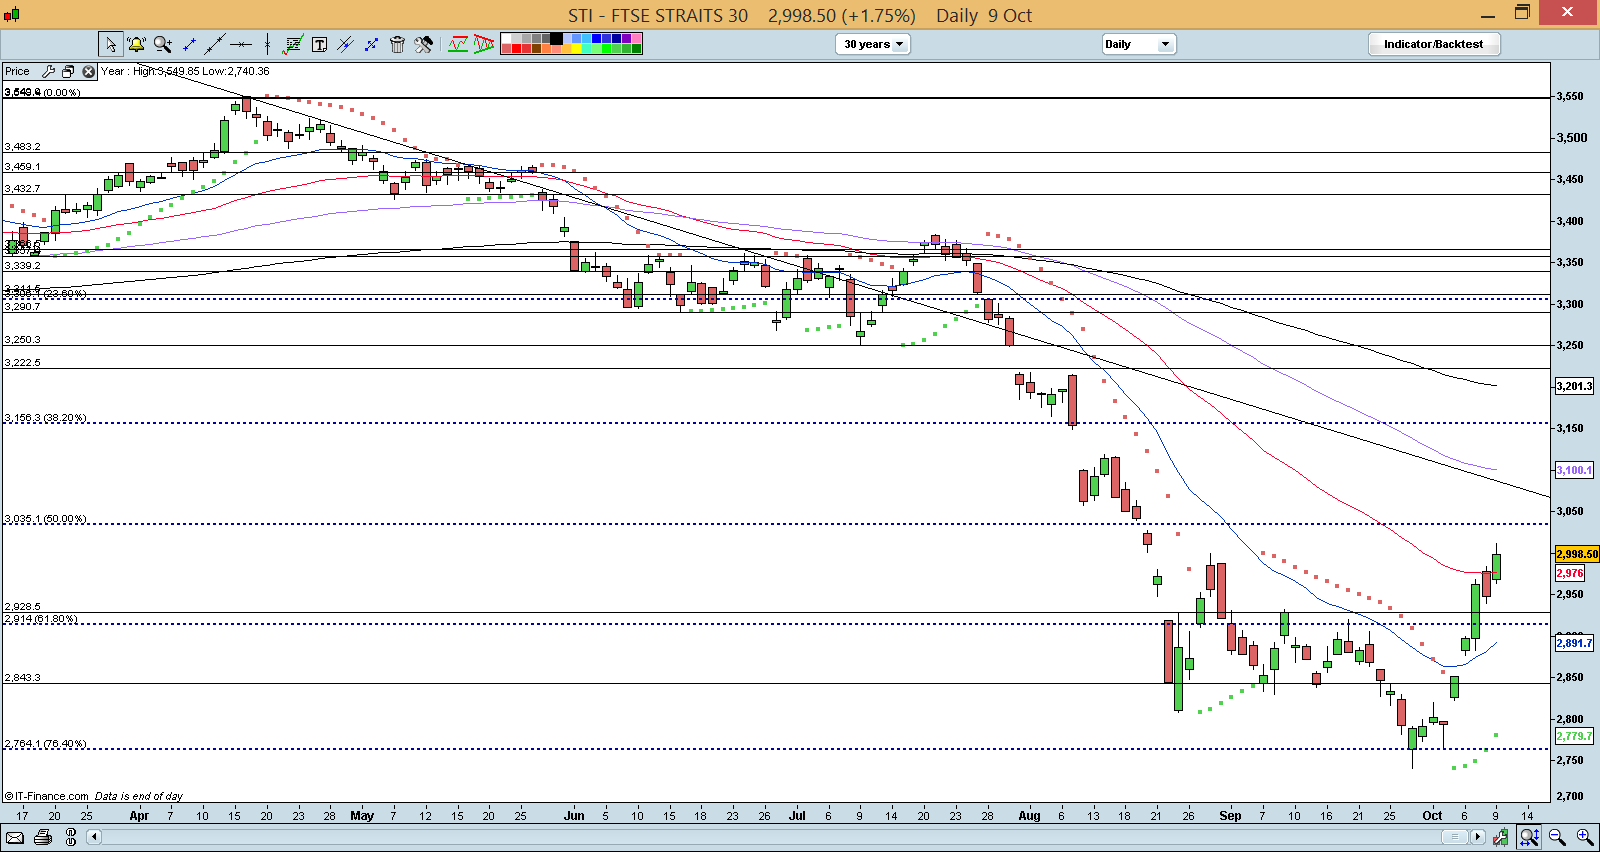
As mentioned above, STI performed in line with expectations. It closed at 2,999 on last Fri.
With reference to Chart 3 below, STI breached 2,929, negating the bearish tinge in this chart. 21D exponential moving average (“EMAs”) has started to turn up. However, with the sharp 259 points rally from the low of 2,740 in eight trading days, STI may not be able to move above 3,039 – 3,100 in the near term.
In line with the other charts, I would prefer STI to consolidate above 2,929 before making its next ascent. It is noteworthy that the chart looks bearish if 2,929 is broken.
Near term supports: 2,976 / 2,929 / 2,914
Near term resistances: 3,029 / 3,039 / 3,063
Chart 3: STI performed in line with expectations
Source: CIMB chart as of 9 Oct 15
FTSE ST Small Cap Index (“FSTS”)
Previously, I wrote that although FSTS has greater relative strength than the other indices, it has no visible chart reversal patterns and I mentioned that it was likely that FSTS should consolidate first before staging the next up-move. FSTS indeed consolidated and touched near my previously mentioned support of around 401 before closing 5% higher at 421 on last Fri.
Based on Chart 4 below, FSTS seems to have staged an upside breakout from an ascending triangle formation. An eventual measured technical target is around 452. Despite this potential bullish formation, FSTS needs to clear the resistance levels of 422 & 440 and its declining 50D EMA, currently also around 440. Near term supports are at 419 / 410 – 411.
Chart 4: FSTS – potential ascending triangle formation

Source: CIMB chart as of 9 Oct 15
Conclusion
In a nutshell, it is fair to say that the bearishness in the above charts are mostly negated with some charts showing bullish developments. Notwithstanding the above, I am trimming my percentage invested to below 65% by selling into this rally. I am cautious of the upcoming key events and prefer to err on the side of caution:
a) Singapore 3Q advance GDP report to be released around mid Oct;
b) U.S. corporate results;
c) Singapore corporate results (I have already sent the latest corporate results calendar to both my clients and readers on my website signups list. Will re send once I have the latest updated results calendar);
d) MAS Monetary Policy Statement.
I have shared the above to all my clients and readers who are on my website signups list on 8 Oct via email. As mentioned previously, readers who wish to be notified of my write-ups and / or informative emails, they can consider to sign up at http://ernest15percent.com so as to be included in my mailing list. However, this reader’s mailing list has a one or two day lag time as I will (naturally) send information (more information and more details) to my clients first.
Disclaimer
Please refer to the disclaimer here
Wow, wonderful weblog structure! How long have you been running a blog for?
you make running a blog glance easy. The overall look of your website
is wonderful, as well as the content! You can see similar here sklep internetowy