Dear all,
It has been a hectic week. 3 stock charts caught my attention, together with their price action yesterday.
1. Innovalues – potential chart breakout
It closed +0.065, or 10% to 0.720 yesterday. Day range 0.670 – 0.730. Ave analyst TP: $0.980. Estimated dividend yield is around 4.5%.
Noteworthy points
1. 3Q results – if I based on their historical performance, it is likely to be good. This is because company has typically met and usually exceeded estimates;
2. Chart seems to have broken out from the recent tight trading range of $0.630 – 0.675 on a six month high volume. If it can break $0.725 – 0.735 with volume, an eventual measured technical target is around $0.840. This also coincides with point 3 below and the 76.4% Fibonacci retracement. Indicators such as MACD and RSI are strengthening. OBV is approaching all-time highs which is another bullish indicator. (See Chart 1 below)
Near term supports: $0.710 / 0.685 / 0.675
Near term resistances: $0.735 / 0.750 / 0.775
Chart 1: Innovalues reached near the resistance $0.725 – 0.735

Source: CIMB chart as of 22 Oct 15
3. Innovalues has a track record of moving upwards in anticipation of its release of financial results. Based on my compilation below, if I buy 4 weeks before results, I typically have a positive return between 10 – 32% with an average return of around 21%. Taking the high and low percentage returns, this translates to around S$0.704 – $0.845. However, do note that past performance does not guarantee future performance.
Table 1: Past Innovalues’ share price performance
| Quarter results | Closing Price 4 weeks before results | Median Price one day after results | % chg |
| 3QFY14 | 10 Oct px: $0.410 | 10 Nov px: $0.4507 Nov 2014 results | 10.00% |
| 4QFY14 | 27 Jan px: $0.490 | 27 Feb px: $0.60826 Feb results | 24.00% |
| 1QFY15 | 14 Apr px: $0.655 | 14 May px: $0.86513 May results | 32.00% |
| 2QFY15 | 6 Jul px: $0.735 | 6 Aug px: $0.865 Aug results | 17.00% |
| 3QFY15 | 6 Oct px: $0.640 | 6 Nov px: $?5 Nov results | $0.704 – $0.845 |
Source: Ernest’s compilations
4. For those readers who are on my readers’ mailing list, I will send u the attached analyst reports released this month in my email.
P.S: I have informed some of my clients on Innovalues on Wed and Thurs due to Innovalues’ chart setup and price action.
2. Hi-P – breached the downtrend line since start of the year
Hi-P closed +0.04 or 10% to $0.450. Day range 0.420 – 0.450. Ave analyst TP: $0.593. Estimated dividend yield is around 1.2%.
Noteworthy points
1. Yota phone’s majority shareholder changed hands
According to this article http://appleapple.top/yotaphone-no-longer-russian-the-chinese-bought-a-controlling-stake-in-yota-devices/, Rex Global Entertainment (“Rex”) bought 64.9% stake in Yota phone, worth about US$100m.
For those who are not familiar in Rex, it is an investment holding firm, listed on the Hong Kong stock exchange. It is engaged in investments in real estate, entertainment, gaming, etc.
Based on my personal guess, with this change in share ownership to a financially stronger shareholder, there may be progress in the legal suit between Yota phone and Hi-P. (Pure guess only)
2. Chart seems to have breached a downtrend line since Jan 2015
With reference to Chart 2 below, Hi-P breached the downtrend line established since Jan 2015, accompanied by a two month high volume. In addition, Hi-P saw more volume in days where it closed higher which was a positive sign. Indicators such as MACD and RSI are strengthening. Notwithstanding the positive tinge in the chart, it is noteworthy that Hi-P is a pretty illiquid stock and this lack of liquidity may skew the chart to a certain extent.
Near term supports: $0.425 / 0.415 / 0.395
Near term resistances: $0.460 / 0.475 / 0.490
Chart 2: Hi-P breached the downtrend line since start of the year
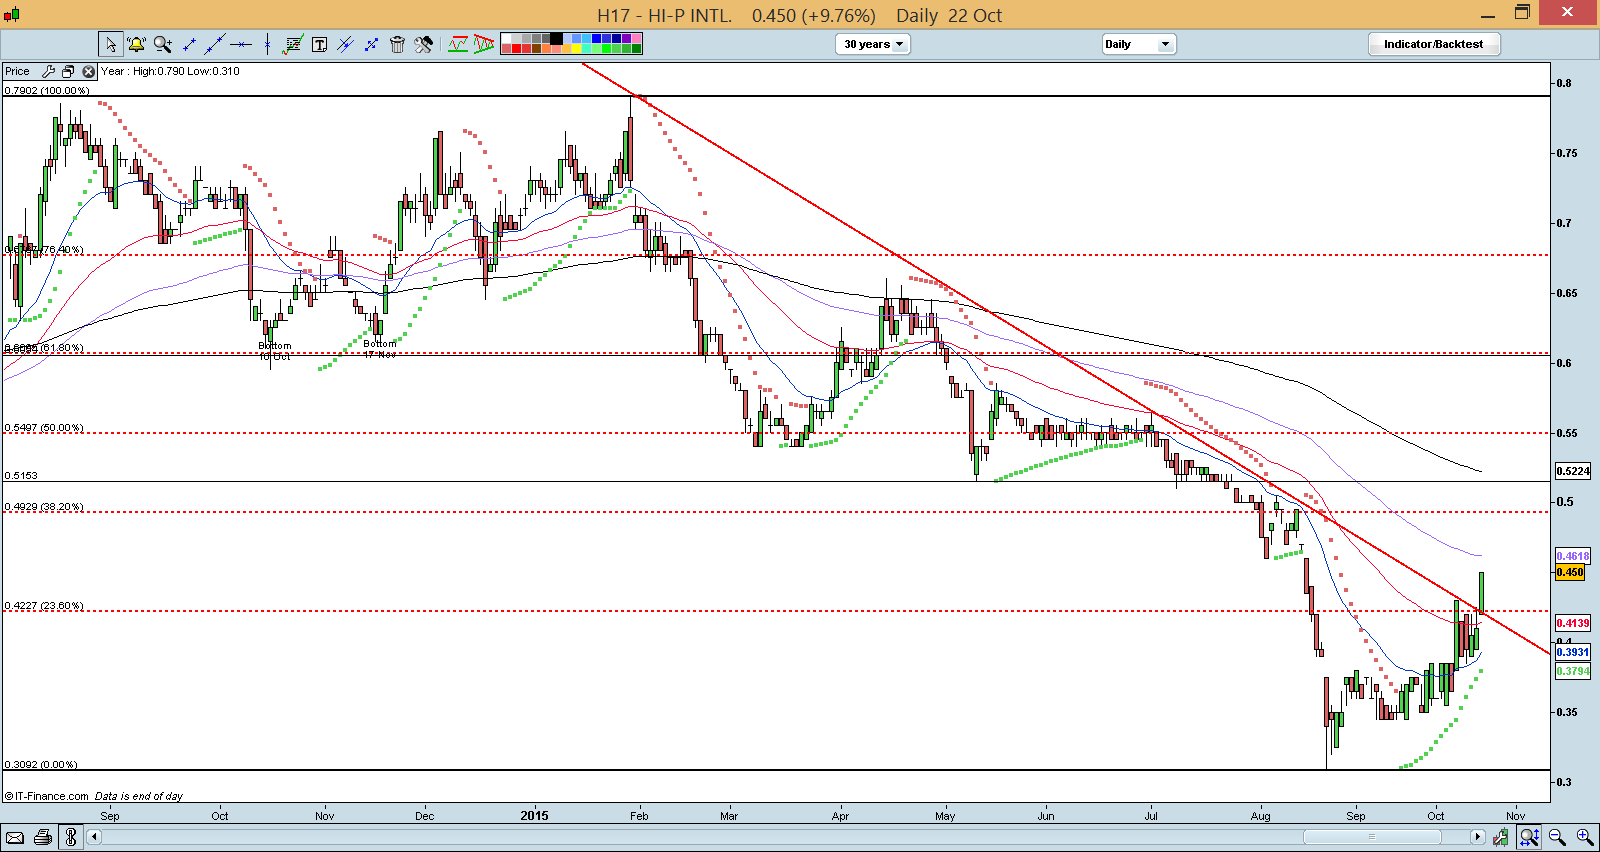
Source: CIMB chart as of 22 Oct 15
3. Yamada chart – potential chart breakout in the making?
Yamada closed +0.002, or 2% to 0.085 yesterday. Day range 0.083-0.085. As there is no analyst coverage on Yamada, there is neither an analyst estimate nor an estimated dividend yield. Historical dividend yield is around 1.4%.
Noteworthy points
1. Yamada seems to be in the process of breaking out from its downtrend line around 0.086. Indicators such as MACD and RSI are strenghtening. OBV is near a record high. However, it needs to break out of $0.086 with volume expansion and on a sustained basis in order for the breakout to be valid.
Near term supports: $0.081 / 0.077 / 0.075
Near term resistances: $0.086 / 0.088 / 0.095
Chart 3: Yamada – potential chart breakout in the making?
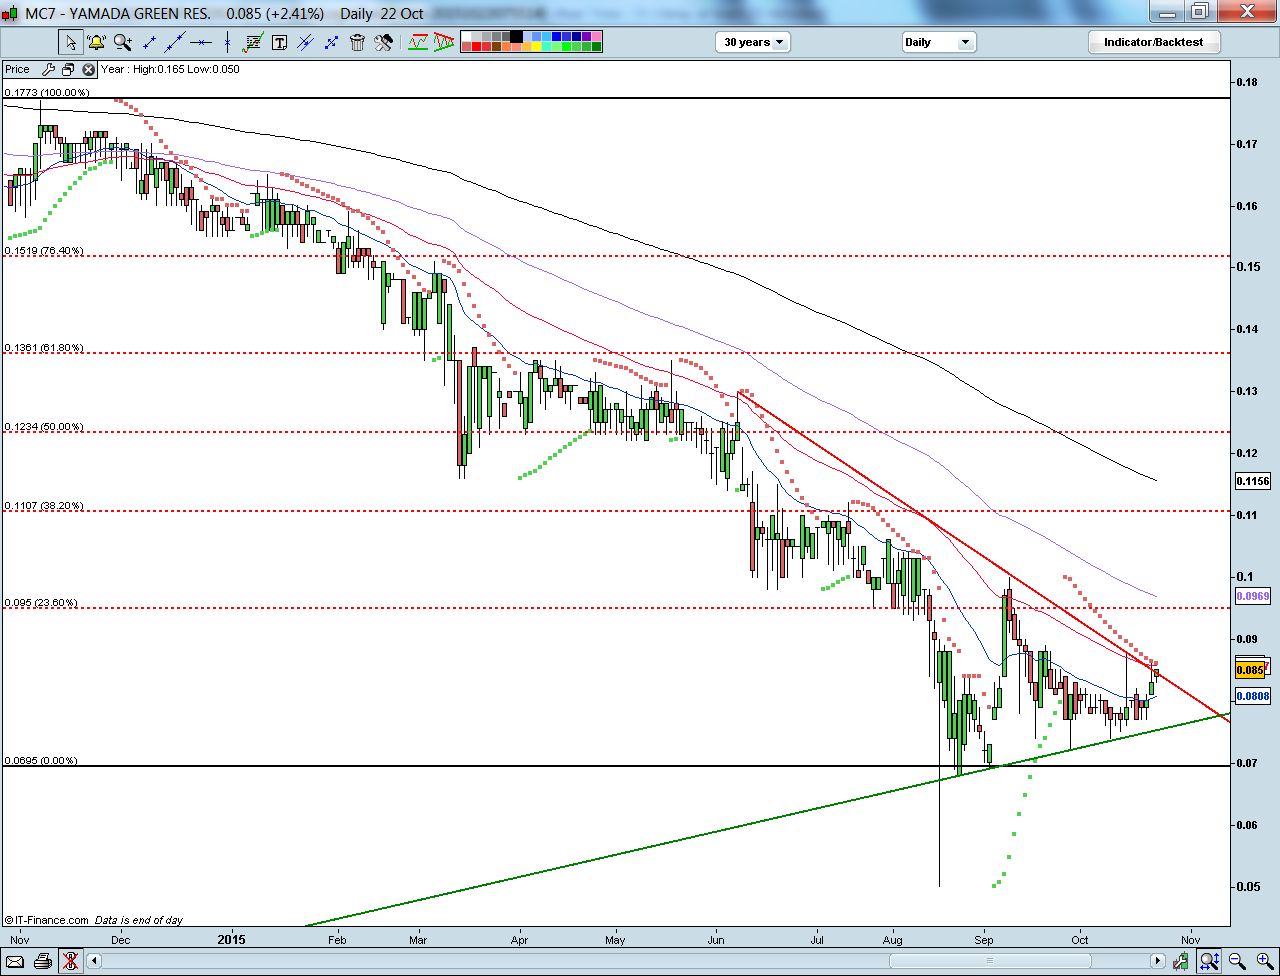
Source: CIMB chart as of 22 Oct 15
2. Valuations seem undemanding. Yamada’s NAV / share is around $0.257. It is trading at around 0.33x Price to Book and around 3x PE. According to Bloomberg, average price to book since IPO was around 0.8x.
3. Major shareholders raised stake
Since 7 Sep 2015, Mr Chen Qiuhai, CEO of Yamada bought 7.15m shares at an average price of $0.0838 / share on the open market. He also subscribed for approximately 98m Yamada rights shares which boosted his stake to 37.1%.
Mr Gilbert Ee, CEO of GSH Corp also raised his stake from 1.1% to 8.2%.
Besides the above changes, it is noteworthy that Mr Sam Goi still has around 7.8% deemed interest.
Conclusion
The above is written based more on the charts’ developments. I have included some noteworthy points on Innovalues, Hi-P and Yamada for your general reference.
As mentioned previously, readers who wish to be notified of my write-ups, selected analyst reports and / or informative emails, they can consider to sign up at http://ernest15percent.com so as to be included in my mailing list. However, this reader’s mailing list has a one or two day lag time as I will (naturally) send information (more information and more details) to my clients first.
Disclaimer
Please refer to the disclaimer here
Great info. Lucky me I discovered your blog by chance (stumbleupon). I’ve bookmarked it for later!
Im obliged for the article.Much thanks again. Fantastic.