Dear readers,
The past two weeks have been extremely hectic where I have raised my equity allocation from around 65% to 150%. What has caused me to raise my equity allocation?
Read on to find out more.
S&P500 Index
Two weeks ago, with reference to Chart 1 below, I mentioned the following on the S&P500:
a) I prefer the S&P500 to wait and observe whether S&P500 retreat and test the resistance turned support region 1,990 – 2,000 before moving higher;
–> S&P500 first hit around 2,021 on 12 & 13 Oct before it weakened to touch an intraday low of 1,991 on 14 Oct. This is in line with my preference. It subsequently moved higher (see point b below).
b) A possible double bottom formation may be in the making with the neckline at 2,021 but needs to observe whether there is a sustained break.
–> S&P500 broke the neckline 2,021 on 15 Oct 2015 and consolidated around 2,021 for four consecutive days. The intraday low for the four sessions was only 2,017. This was another positive development.
c) Considerable resistance can be seen at 2,031 and 2,040 – 2,045, especially the latter.
–> S&P500 moved up on the fifth session (i.e. 22 Oct) and breached the key resistances 2,031 and 2,040 – 2,045 in one powerful up-move. There was follow through buying on 23 Oct which saw S&P500 close at 2,075.
Looking ahead, I believe the downtrend which we see in Aug 2015 has reversed with the confirmation of the double bottom formation. The eventual measured technical target from this double bottom formation points to around 2,173. Do note that this is an eventual technical target and may not be attained soon.
In my opinion, S&P500 may move up a bit more and consolidate, as indicators such as RSI are approaching overbought levels soon. RSI closed at 67 last Fri. Nevertheless, it is likely that any retreat / consolidation is likely to be minor and unlikely to break below 2,021.
Near term supports: 2,070 / 2,052 / 2,040 – 2,045
Near term resistances are around 2,075 / 2,100 / 2,133 – 2,135
Chart 1: S&P500 formed a bullish double bottom formation
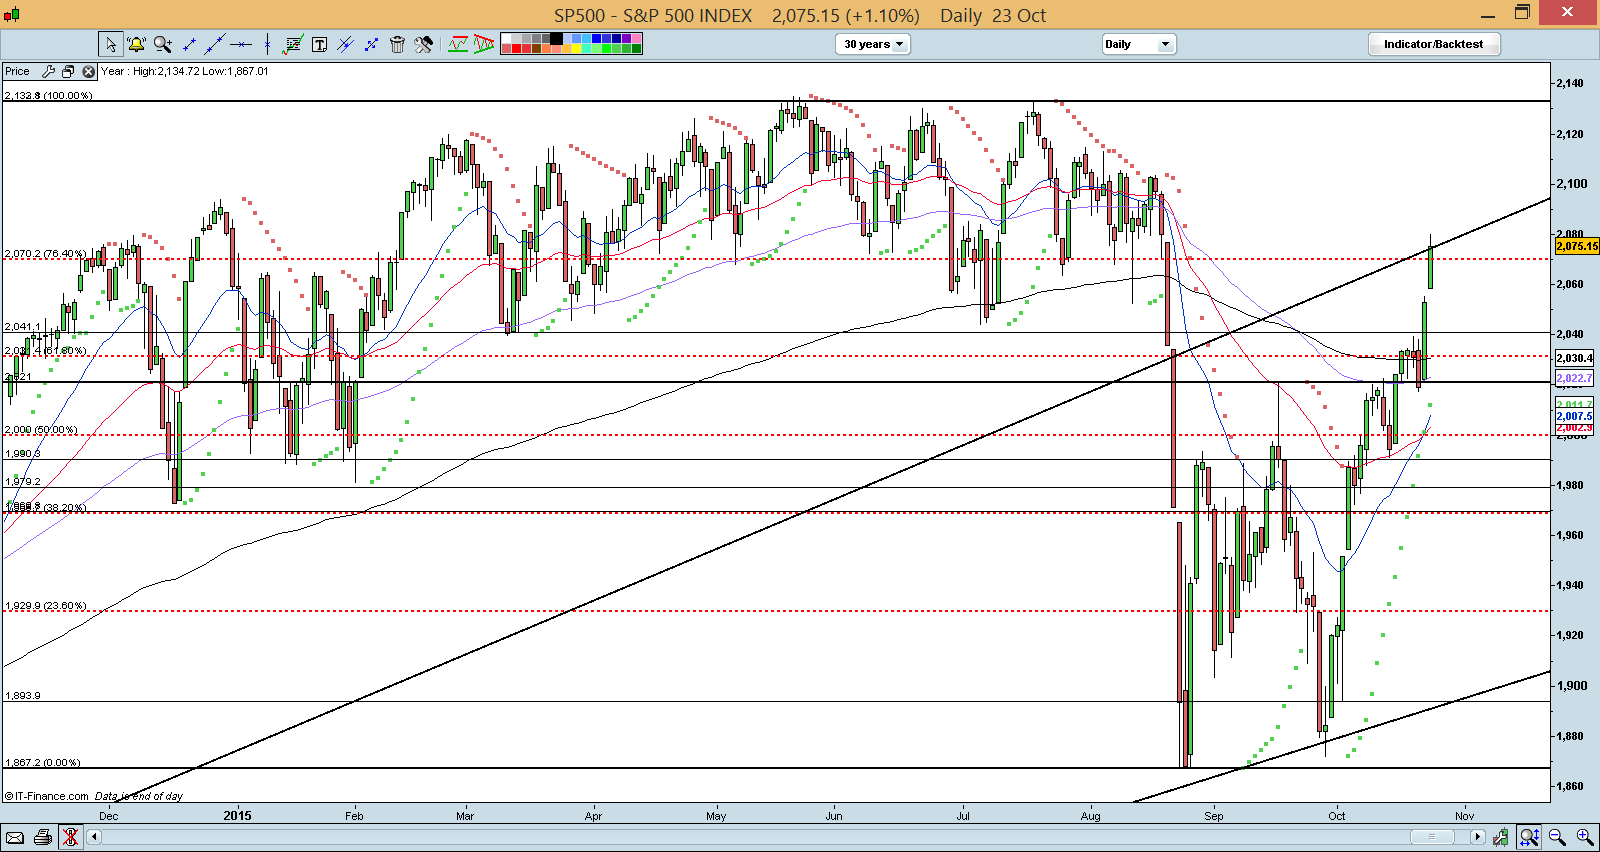
Source: CIMB chart as of 23 Oct 15
Hang Seng Index
Two weeks ago, I mentioned that Hang Seng seemed to have broken above a potential double bottom formation with an eventual measured technical target is around 23,820. I also wrote that to be prudent, it would be best for it to consolidate around 21,814 – 22,400 before staging its next up-move.
Hang Seng touched 22,357 on 14 Oct and jumped 2.0% higher on the next trading day. This was an indication of strength. Hang Seng closed 1.3% higher at 23,152 on last Fri.
Based on Chart 2 below, Hang Seng has formed a double bottom formation and an eventual measured technical target of around 23,820 remains valid. Indicators such as RSI and MACD are strengthening. RSI closed at 62.0 which is not overbought yet.
Near term supports: 22,870 / 22,625 / 21,814
Near term resistances: 23,445 / 23,864 / 24,050
Chart 2: Hang Seng – double bottom formation formed
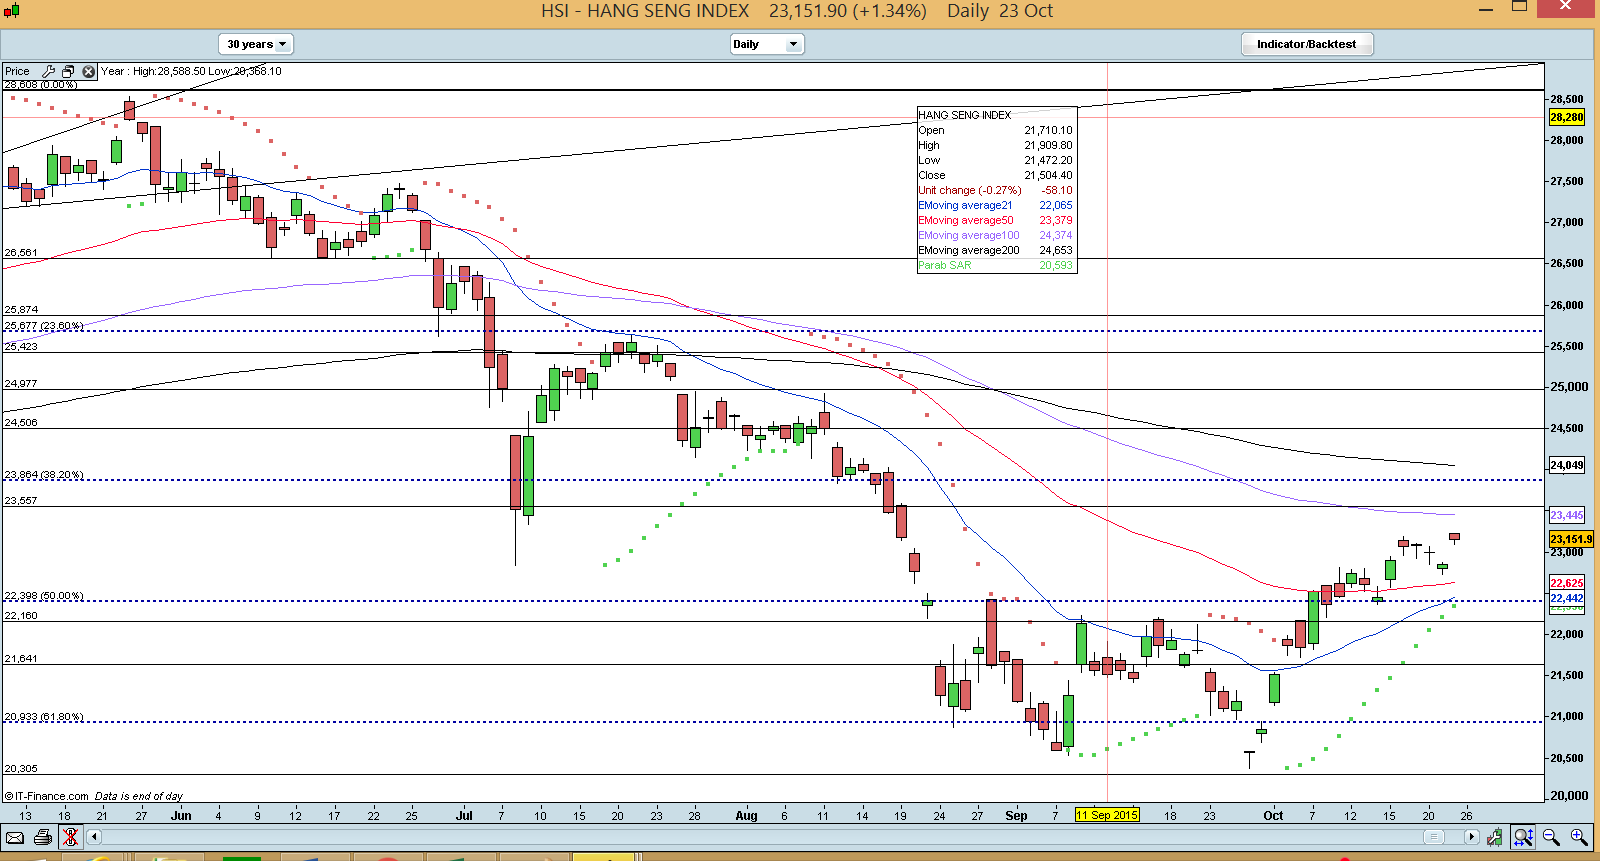
Source: CIMB chart as of 23 Oct 15
STI Index
As mentioned two weeks ago, STI breached 2,929, negating the bearish tinge in this chart. STI consolidated above 2,960 between 12 – 15 Oct. From 16 Oct – 22 Oct, STI traded between 3,013 – 3,047 before gapping up on 23 Oct to close at 3,068.
With reference to Chart 3 below, 21D exponential moving average (“EMAs”) has started to turn up and may be able to form a golden cross with 50D EMA in the next few weeks. RSI closed at 67 on last Fri and is approaching overbought level. (Do note that even if RSI crosses above 70, it does not necessarily mean that it will drop). It just means that any near term potential gains may not be that much and fast. Nevertheless, any retreat should be arrested around the strong support levels of 2,960 – 2,975.
Near term supports: 3,047 / 3,035 / 2,992
Near term resistances: 3,086 / 3,119 / 3,153 – 3,156
Chart 3: STI may form a golden cross in the next few weeks
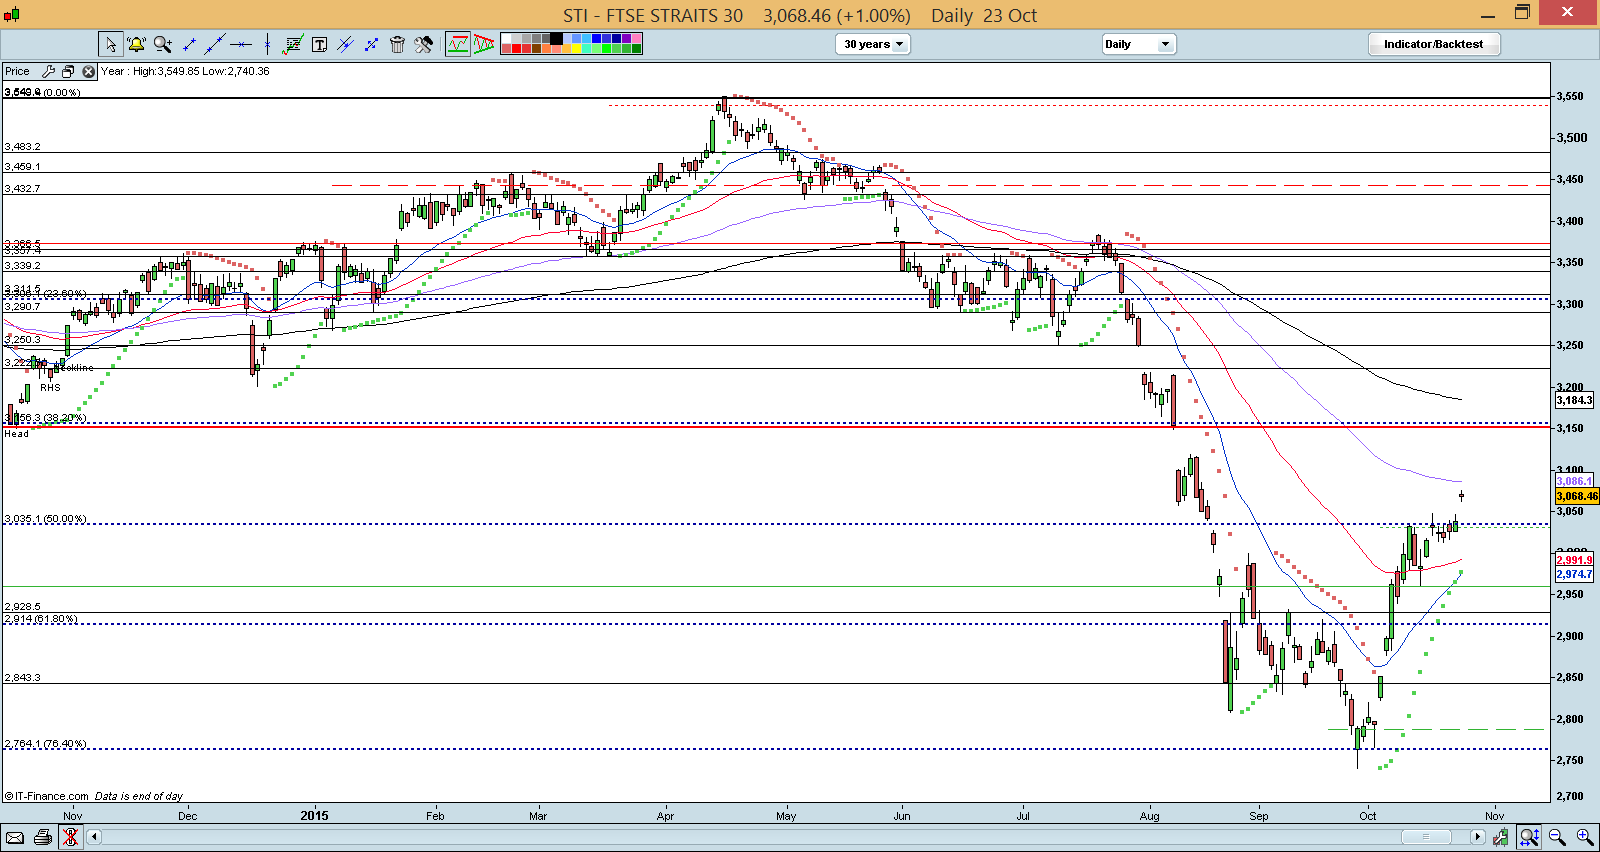
Source: CIMB chart as of 23 Oct 15
FTSE ST Small Cap Index (“FSTS”)
Previously, I wrote that FSTS seemed to have staged an upside breakout from an ascending triangle formation. An eventual measured technical target is around 452.
With the recent price action, the ascending triangle formation is confirmed with an eventual measured technical target of around 452. ADX has been strengthening since 6 Oct and closed at 28.4, indicative of a trend. RSI closed at 69, near overbought levels and is almost at a six month high. FSTS closed at 432 on last Fri.
In short, the trend is up but FSTS may see some resistance 437 – 440. (See Chart 4 below)
Near term supports are at 425 / 422 / 420
Near term resistances are at 437 / 440 / 448
Chart 4: FSTS continues to climb

Source: CIMB chart as of 23 Oct 15
Conclusion
In a nutshell, it is fair to say that the above charts are in an uptrend but approaching overbought levels. Nevertheless any retreat is likely to be mild and temporary.
I have shared my increase in equity allocation and my bullish outlook to some of my clients over the course of last week, especially after S&P500’s chart developments. In addition, I have accumulated other stocks on weakness to punt ahead of their 3Q results thus raising my equity allocation to around 150%. For those who wish to be informed of the latest corporate 3Q results calendar, they can sign up on my website signup list at http://ernest15percent.com.
During this 3Q results period, I may adjust my equity allocation by taking profit and buying other stocks but I am unlikely to exceed 200% invested. Most probably, I am likely to trim my equity allocation to <100% by around mid Nov as I am leaving for holidays in Dec where I will not be able to monitor my positions.
As mentioned previously, readers who wish to be notified of my write-ups and / or informative emails, they can consider to sign up at http://ernest15percent.com so as to be included in my mailing list. However, this reader’s mailing list has a one or two day lag time as I will (naturally) send information (more information, more emails and more details) to my clients first. For readers who wish to enquire on being my client, they can consider to leave their contacts here http://ernest15percent.com/index.php/about-me/
Disclaimer
Please refer to the disclaimer here
want to your client
Hi Sun Yun
U may wish to drop your contacts here http://ernest15percent.com/index.php/about-me/
Thanks.