Dear all,
How’s your weekend? Just to share two interesting charts with you…
1. GKE – ascending triangle formed
On 19 Oct, I have posted a write-up on GKE (see here) where I have written on GKE’s background and future developments. In the write-up, I have pointed out that GKE is in the midst of forming a bullish potential ascending triangle formation. Since my write-up, GKE has risen 11% to close $0.090 on last Fri. Yesterday’s day range was $0.089 – 0.090.
With reference to Chart 1 below, GKE’s ascending triangle formation is confirmed with a decisive break above $0.082 on 19 Oct with volume expansion. It has spent the past two weeks consolidating approximately between $0.087 – 0.091 on a closing basis. OBV continues to hover around multi year highs. 21D exponential moving average (“EMA”) has formed golden crosses by crossing above 50D EMA and 100D EMA on 20 & 21 Oct. 50D EMA has crossed above 100D EMA on 22 Oct. In the next two weeks, 21D EMA may cross above 200D EMA. All the EMAs are rising. Overall, chart looks bullish and the eventual measured technical target (calculated from the bullish break on the ascending triangle formation) at $0.096 remains valid. A break below $0.082 negates the bullish tinge in the chart.
Near term supports: $0.087 / 0.085 / 0.084
Near term resistances: $0.091 / 0.096 / 0.100
Chart 1: GKE ascending triangle formation confirmed
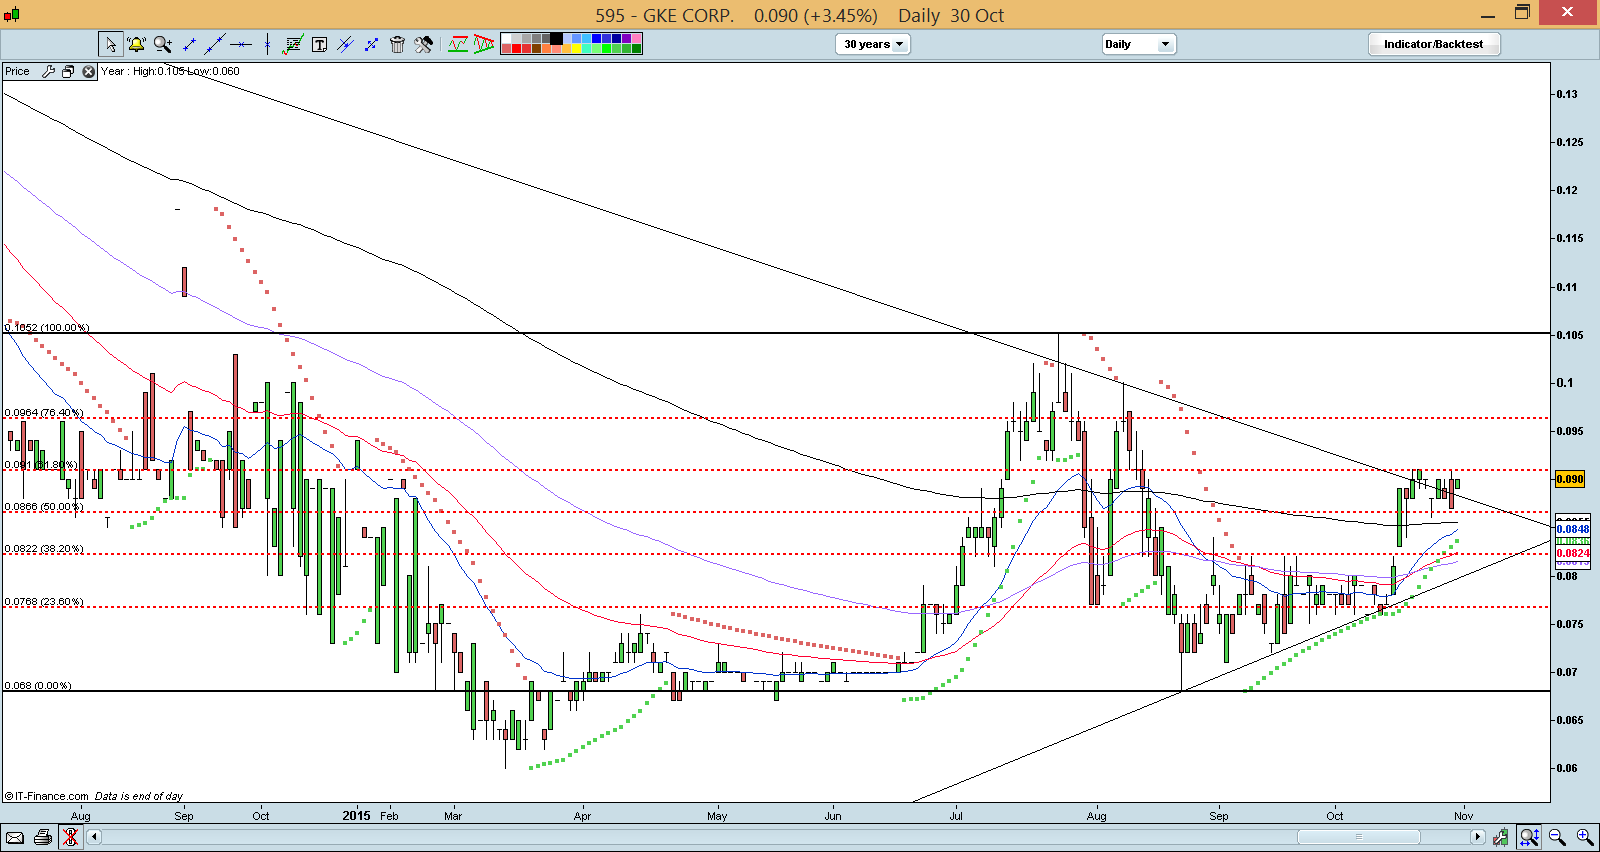
Source: CIMB chart as of 30 Oct 15
2. Innovalues – bullish break above a two month trading range
On 23 Oct, I have done a brief write-up on Innovalues citing its chart development and price action. Furthermore, I have included in my write-up on my personal compilation on Innovalues’ share price run-up for the past four quarters prior to its results release. (Read here for more details). Since 23 Oct, Innovalues has appreciated from $0.720 on 22 Oct to an intraday high of $0.800 on 28 / 29 Oct and closed at $0.780 yesterday. Yesterday’s day range was 0.750 – 0.780. Ave analyst TP: $0.980. Estimated dividend yield is around 4.2%.
With reference to Chart 2 below, Innovalues has breached its two month trading range of between $0.630 – 0.735 on 23 Oct. OBV hovers near multi year highs and ADX has jumped from 14 on 21 Oct to 26 on 30 Oct which is indicative of a trend. All EMAs are rising with 21D EMA forming golden cross with 200D EMA and 50D EMA. It is likely that 21D EMA will cross above 100D EMA soon. Given the chart developments, the eventual measured technical target of around $0.840 remains valid. A break below $0.725 negates the bullish tinge in the chart.
Near term supports: $0.750 / 0.735 / 0.725
Near term resistances: $0.800 / 0.820 / 0.840
Chart 2: Innovalues breached resistance $0.725 – 0.735
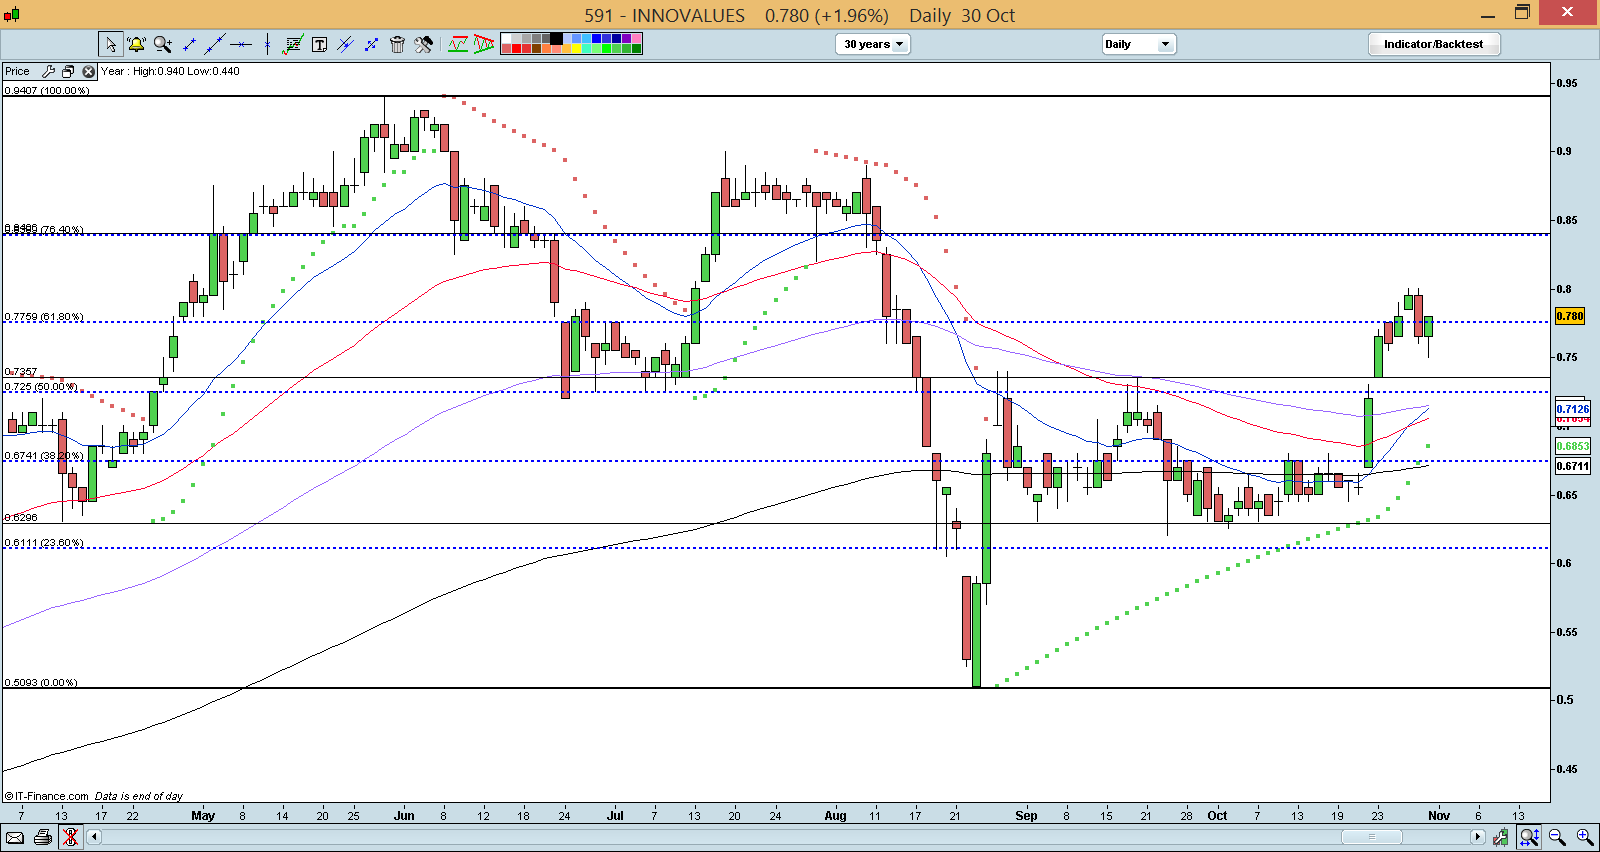
Source: CIMB chart as of 30 Oct 15
Conclusion
The above is an update on the companies’ charts developments, pursuant to my previous write-ups.
As mentioned previously, readers who wish to be notified of my write-ups, selected analyst reports and / or informative emails, they can consider to sign up at http://ernest15percent.com so as to be included in my mailing list. However, this reader’s mailing list has a one or two day lag time as I will (naturally) send information (more information and more details) to my clients first. If you want to be my client, please sign up here http://ernest15percent.com/index.php/about-me/
Disclaimer
Please refer to the disclaimer here
Thanks again for the post.Really looking forward to read more. Fantastic.
Great, thanks for sharing this article.Much thanks again. Fantastic.
Im obliged for the blog post.Really looking forward to read more. Keep writing.
Hey, thanks for the post.
Im grateful for the article.Really looking forward to read more. Awesome.
Wow, great post.Thanks Again. Keep writing.
Very informative blog post.Thanks Again. Much obliged.
I appreciate you sharing this article.Really looking forward to read more. Much obliged.
Very neat post.Thanks Again. Fantastic.
Im thankful for the article post.Really looking forward to read more. Great.
Fantastic blog.Thanks Again.
Appreciate you sharing, great article post.Really looking forward to read more. Fantastic.
Thanks for sharing, this is a fantastic article post.Much thanks again. Really Great.
Thank you for your blog.Really thank you! Really Cool.
Im obliged for the post. Great.
Looking forward to reading more. Great post.Really looking forward to read more. Much obliged.
Great article post. Keep writing.
Great, thanks for sharing this article post. Really Great.
I value the blog post.Really thank you! Really Cool.
This is one awesome blog article. Much obliged.
I cannot thank you enough for the article post. Keep writing.
I really liked your blog article.Thanks Again. Fantastic.
Thanks again for the blog article. Much obliged.
Thanks again for the blog post.Really looking forward to read more. Awesome.
Say, you got a nice article. Really Great.
I loved your blog article.Thanks Again. Cool.
Thanks a lot for the article post. Really Great.
Thanks-a-mundo for the blog post. Cool.
Great, thanks for sharing this post.Really looking forward to read more. Fantastic.
Very informative blog article.Thanks Again. Want more.
Im thankful for the article post.Much thanks again.
Im grateful for the blog article.Thanks Again. Awesome.
Im obliged for the blog article. Cool.
Thank you ever so for you article.Really thank you! Much obliged.
A round of applause for your blog post. Will read on…
Thanks for sharing, this is a fantastic article.Thanks Again. Really Great.
A big thank you for your blog post.Much thanks again. Want more.
I am so grateful for your blog post. Will read on…
Thanks for sharing, this is a fantastic post.Much thanks again. Will read on…
Major thankies for the post.Really looking forward to read more. Fantastic.
Appreciate you sharing, great article.Thanks Again. Much obliged.
wow, awesome post. Cool.
Muchos Gracias for your blog post. Great.
Very informative post. Want more.
Awesome blog article.Much thanks again. Awesome.
Thank you ever so for you post.Much thanks again. Great.
Im thankful for the article.Much thanks again. Will read on…
Thanks so much for the article post. Much obliged.
Fantastic post.Really thank you! Fantastic.
Great blog post.Thanks Again. Really Cool.
Muchos Gracias for your blog. Awesome.
Awesome post.Thanks Again. Fantastic.
Very good blog.Much thanks again.
Looking forward to reading more. Great article.Really looking forward to read more.
Thanks for the article.Really thank you! Will read on…
A big thank you for your article post.Thanks Again. Want more.
Major thankies for the article post. Want more.
Really informative blog. Really Cool.
Major thanks for the blog article.Thanks Again. Keep writing.
Very neat article post.Really looking forward to read more. Fantastic.
Major thanks for the blog.
Looking forward to reading more. Great blog.Really looking forward to read more. Keep writing.