Dear readers,
The past two weeks have been pretty volatile with STI falling as much as 120 points from 23 Oct to 2 Nov before surging 92 points in the following two days. Despite the volatility, this index fluctuation has been in line with my expectations posted in my write-up 2 weeks ago.
What’s my outlook for the next two weeks? Read on to find out more…
S&P500 Index
Two weeks ago, I mentioned that S&P500 might move up a bit more and consolidate, as indicators such as RSI are approaching overbought levels soon. Nevertheless, it is likely that any retreat / consolidation is likely to be minor and unlikely to break below 2,021.
With reference to Chart 1 below, S&P500 suffered some minor profit taking on 26 & 27 Oct but closed 1.2% higher from 2,075 on 23 Oct to 2,099 on last Fri.
Looking ahead, S&P500 seems relatively stronger than HK and Singapore markets. All the exponential moving average (“EMAs”) are trending higher on the back of a rising ADX (currently at 27.1). 21D EMA has already formed golden crosses with 50D, 100D and 200D EMA. In the next one month, there is a possibility that 50D, 100D and 200D EMA may also form golden crosses with one another.
The eventual measured technical target from the previously mentioned double bottom formation points to around 2,173. Do note that this is a medium term target. A break below 2,021 negates the bullish tinge in the chart.
Near term supports: 2,085 / 2,070 / 2,061
Near term resistances are around 2,117 / 2,133 – 2,135 / 2,150
Chart 1: S&P500 chart seems relatively stronger than HK & Singapore
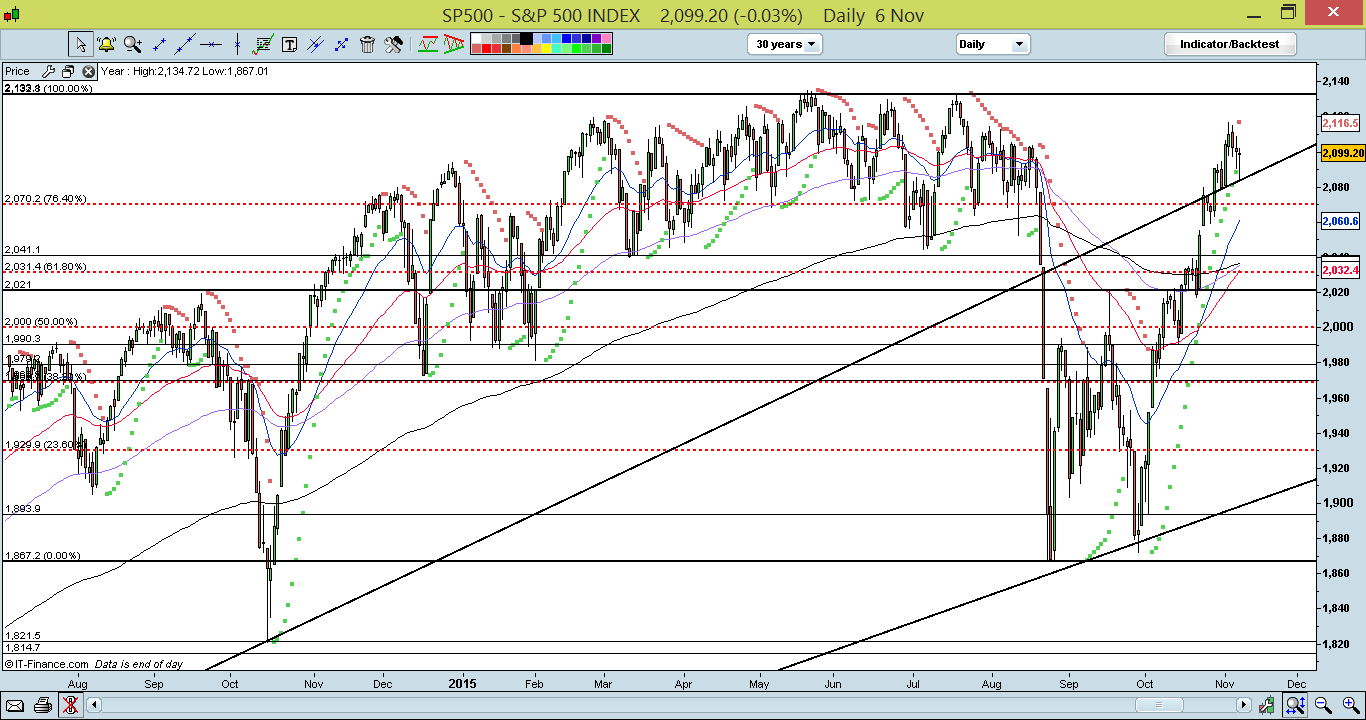
Source: CIMB chart as of 6 Nov 15
Hang Seng Index
Two weeks ago, I mentioned that Hang Seng has formed a double bottom formation and an eventual measured technical target of around 23,820 remains valid. I also mentioned that Hang Seng near term support and resistance were around 22,870 and 23,445 respectively.
Over the past two weeks, Hang Seng touched an intraday high of 23,424 (21 pts away from my above mentioned resistance) on 26 Oct before closing at 22,867 (3 pts away from my above mentioned support) on last Fri. Based on Chart 2 below, Hang Seng’s momentum seems to have eased. ADX has weakened from 24.8 to 22.0. Indicators such as RSI and MACD have also eased. In the near term, it is likely that Hang Seng may develop a range trading pattern around 21,530 – 23,936. It is noteworthy that a break below 22,160 negates the double bottom chart formation.
Near term supports: 22,690 / 22,296 – 22,373 / 22,160
Near term resistances: 23,338 / 23,510 – 23,560 / 23,820
Chart 2: Hang Seng – momentum seems to be easing

Source: CIMB chart as of 6 Nov 15
STI Index
As mentioned two weeks ago, I mentioned that with the RSI approaching 70, any near term potential gains might not be that much and fast. However, any retreat should be arrested around the strong support levels of 2,960 – 2,975.
STI performed exactly in line with expectations. It gapped up on 26 Oct to touch an intraday high of 3,105 before profit taking set in, which pushed STI down 157 points to touch an intraday low of 2,948 on 2 Nov, but closed off the lows to 2,974. It is noteworthy that STI also opened at 2,975 on 30 Oct but closed off the lows to 2,998 on 30 Oct. This corroborates the strength of the aforementioned strong support 2,960 – 2,975. Furthermore, STI promptly rebounded after closing off the lows on 2 Nov and moved up 92 points in the following two days. It eventually closed at 3,010 on last Fri.
With reference to Chart 3 below, 21D EMA is converging with 50D EMA but it remains to be seen whether there is a golden cross as 21D EMA seems to be plateauing. In addition, the weak and sliding ADX (currently at 20.2) may reduce the effectiveness of any potential golden cross. Indicators such as RSI and MACD have eased. It is likely that STI may trade sideways in a range between 2,827 – 3,150 in the near term. It is noteworthy that the sideways range is large as we are approaching year end where it is usually more volatile as liquidity / trading activity eases.
Near term supports: 3,001 / 2,975 / 2,948
Near term resistances: 3,051 / 3,065 / 3,075
Chart 3: STI may range trade 2,827 – 3,150
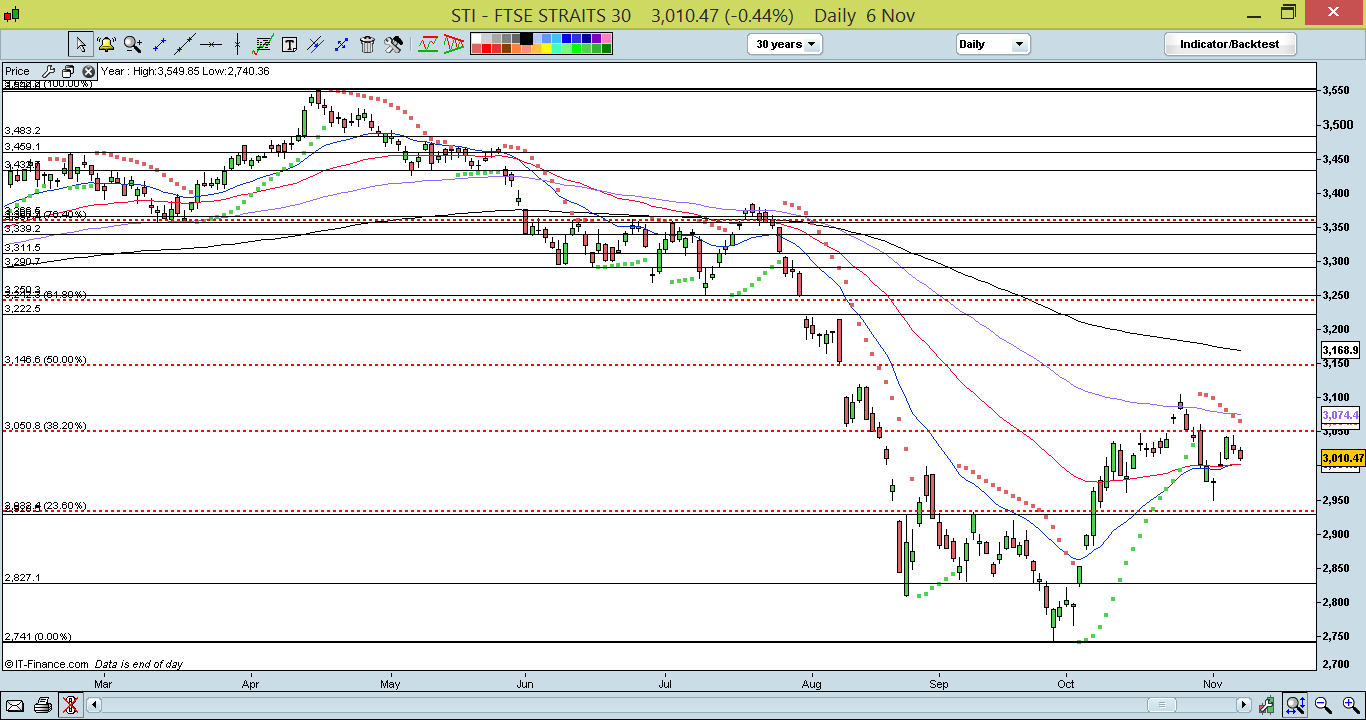
Source: CIMB chart as of 6 Nov 15
FTSE ST Small Cap Index (“FSTS”)
Two weeks ago, I wrote that FSTS’ trend is up but FSTS may see some resistance 437 – 440.
FSTS touched an intraday high of 435 on 26 Oct before profit taking set in. It touched an intraday low of 419 on 2 Nov but closed at 420 on 2 Nov. It subsequently moved higher and closed at 426 on last Fri.
Similar to STI and Hang Seng, FSTS’ momentum seems to be easing. Indicators such as RSI and MACD have eased. ADX has declined from 28.4 on 23 Oct to 20.2 on 6 Nov. In the near term, FSTS may range trade between 410 – 439. (See Chart 4 below)
Near term supports are at 422 / 419 – 420 / 410.
Near term resistances are at 429 / 435 / 439.
Chart 4: FSTS may range trade between 410 – 439

Source: CIMB chart as of 6 Nov 15
Conclusion
In a nutshell, notwithstanding the relatively stronger S&P500 chart, HK and Singapore charts’ momentum are easing. For my personal equity allocation, I have taken profit on some of my stocks and have reduced my equity allocation to around 60%. During this 3Q results period, I may tactically raise my equity allocation but it is unlikely to exceed 100% because
a) HK and Singapore charts’ momentum are easing. As we approach Dec, Asian markets may focus their attention on the potential U.S. rate hike and their possible implications on our Asian markets;
b) Dec (at least for a large part of Dec) is typically a quiet period with lower liquidity which may result in higher volatility.
c) Once the 3Q corporate results are out, there are likely to be fewer near term catalysts to trade on;
d) Importantly, I will be leaving for my holidays in mid Dec thus its best to liquidate most of my positions.
Having said the above, I am unlikely to reduce my equity allocation to 0% (more likely around the region of 30-50%) as I am still positive about equities over the medium term. Furthermore, I have a few stocks which are on my watch list and I am waiting to accumulate on weakness. (Clients will be told in due course after my research.)
As mentioned previously, readers who wish to be notified of my write-ups and / or informative emails, they can consider to sign up at http://ernest15percent.com so as to be included in my mailing list. However, this reader’s mailing list has a one or two day lag time as I will (naturally) send information (more information, more emails and more details) to my clients first. For readers who wish to enquire on being my client, they can consider to leave their contacts here http://ernest15percent.com/index.php/about-me/
Disclaimer
Please refer to the disclaimer here
ivermectin 1 cream generic ivermectin – generic stromectol