Dear readers,
Happy New Year! Hope your New Year has been great.
It has not been so great for our markets. S&P500 registered its worst five-day slide amounting to 6%, the worst on record. China index dropped about 10% for the past one week and oil clocked a more than 10% drop this week. Is this Armageddon? What’s next for our markets?
Read on to find out more…
S&P500 Index
Just to recap what I have mentioned on 24 Dec 2015, I wrote “it seems bullish as the exponential moving averages (“EMAs”) seem to be pulling apart and trending higher. However, at this point, it is premature to conclude that as time is required to observe whether the EMAs are indeed pulling apart and trending higher. Furthermore, the weak ADX at 18.3 on 24 Dec 2015 may reduce its effectiveness.”
–> As mentioned, time is required to observe whether the EMAs are pulling apart and they aren’t. The EMAs have turned down and formed death crosses around 4 – 6 Jan 2016.
I also mentioned “As 2,021 is not broken on a sustained basis, there is still a mild positive bias in the chart.”
–> 2,021 broke on a sustained basis, thus invalidating the mild positive bias. S&P500 closed at 1,922 on last Fri.
Looking ahead, the chart has turned bearish due to the formation of death crosses with a rising ADX. (ADX rose from 18.3 on 24 Dec 2015 to 22.2 on 8 Jan 2016.) Secondly, 2,021 was broken on a sustained basis. (It is noteworthy that S&P500 tested 2,022 on 5 Jan but failed to breach it and went down subsequently) Thirdly, S&P500 has broken a long term uptrend established since Nov 2011. One mild saving grace is that S&P500 RSI has dipped to 29.7, the lowest since 26 Aug 2015 which may trigger a mild rebound as oversold pressures mount. However, the trend is bearish for now. Any rebound is likely to be arrested around the strong resistance region 2,038 – 2,050. (See Chart 1 below).
Near term supports: 1,910 / 1,904 / 1,894
Near term resistances are around 1,930 / 1,970 / 1,980
Chart 1: S&P500 turns bearish after breaking 2,021
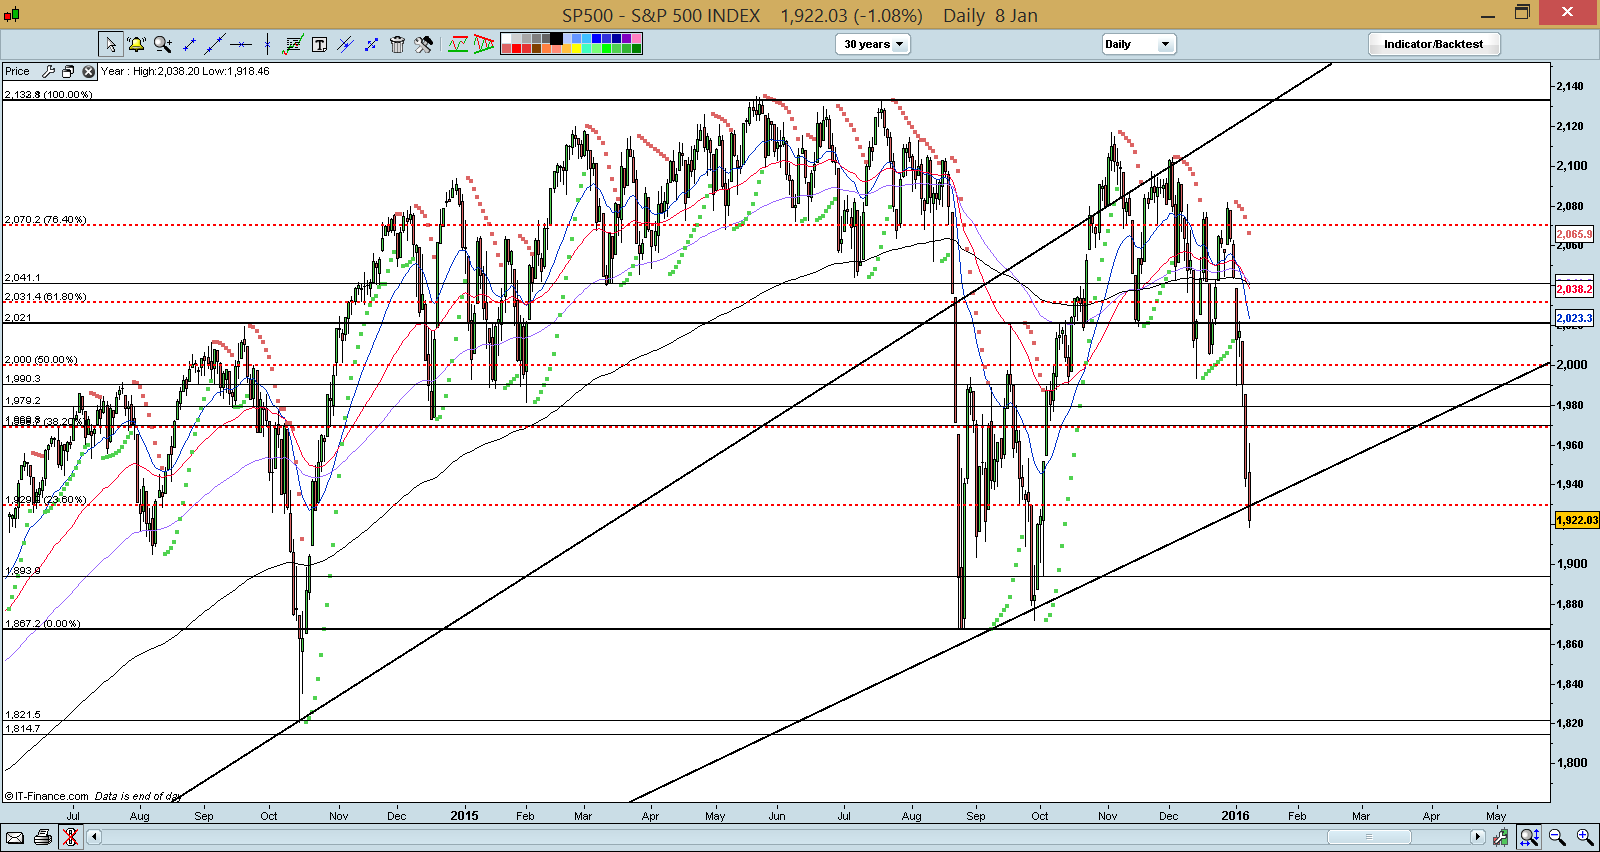
Source: CIMB chart as of 8 Jan 16
Hang Seng Index
On 24 Dec 2015, I mentioned that “Hang Seng seems to be on the verge of a breakout of its two month plus potential flag pattern. A sustained break above 22,300 should provide further evidence of this flag breakout Let’s observe whether it breaks out in the next two weeks.”
–> Hang Seng was not able to breach 22,300 hence the breakout did not materialize.
I also mentioned “a sustained break below the downward channel is bearish”.
–> Hang Seng broke below the downward channel on 7 Jan 2016 and closed for two consecutive days below the channel.
Hang Seng broke the lower line of the downward channel and closed at 20,454 on last Fri. As a result, the overall chart has a bearish tinge. It is testing the support around 20,300 – 20,368 which is around the 29 Sep 2015 low. RSI closed at 28.0 on last Fri. A bearish outlook is confirmed if it breaks 20,300 – 20,368 on a sustained basis. (See Chart 2 below).
Near term supports: 20,300 – 20,368 / 20,120 / 19,800
Near term resistances: 20,780 / 20,950 / 21,450
Chart 2: Hang Seng – testing the critical support 20,300 – 20,368

Source: CIMB chart as of 8 Jan 16
STI Index
I wrote that “21D EMA seems to have stopped falling with supportive parabolic SAR. Indicators such as RSI and MACD are strengthening which may imply that STI may trend higher in the next two weeks.”
–> 21D EMA continues to fall on 4 Jan amid a reversal in parabolic SAR. Indicators such as RSI and MACD weaken too.
I also wrote that “A break above 2,940 on a sustained basis negates the bearish tinge in the chart.”
–> STI was not able to break above 2,940 hence the bearish tinge in the chart is still present. In fact, it has worsened with the falling 21D EMA and weakening indicators etc.
I published my market outlook on STI on New Year Day on my blog noting the challenging conditions for our Singapore market at least for the 1H2016. (Please refer to here for the write-up)
–> This seems to be true as bulk of the losses came from the week of 4 Jan 2016.
STI has fallen 127 points, or 4.4% from 24 Dec 2015 to close 2,851 on 8 Jan 2016. STI broke below 2,740 (intraday low seen on 29 Sep 2015) and tested the low of 2,698 last Fri which was also the low seen on Jun 2012 (Euro crisis). RSI closed at 30.1 last Fri. In my opinion, STI’s important support is around 2,698 – 2,740. It will be negative if it breaks on a sustained basis. We have to observe whether it holds especially with the weak U.S. performance overnight. (See Chart 3 below)
Near term supports: 2,740 / 2,698 / 2,680
Near term resistances: 2,763 / 2,800 / 2,827
Chart 3: STI important support around 2,698 – 2,740
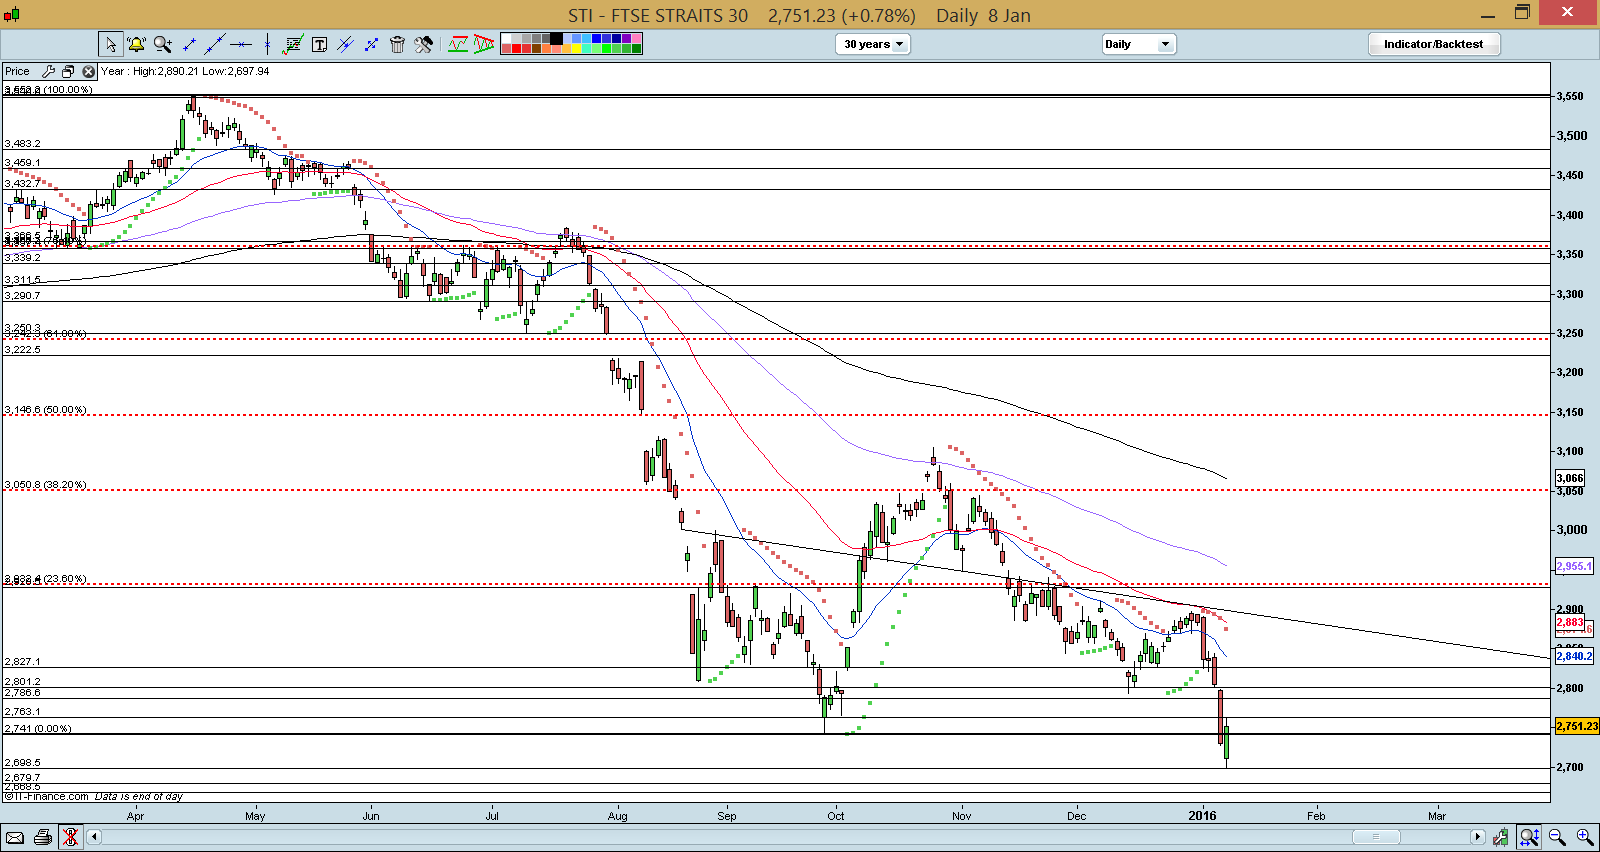
Source: CIMB chart as of 8 Jan 2016
FTSE ST Small Cap Index (“FSTS”)
On 24 Dec 2015, I wrote that “FSTS’ chart does not look that bearish as on 4 Dec. Similar to STI, FSTS may trend higher. 21D EMA seems to have stopped falling with supportive parabolic SAR. Indicators such as RSI and MACD are strengthening.”
–> FSTS has greater relative strength than STI. It dropped about 6 points or 1.6% for the past two weeks, vis-à-vis 4.4% in the STI. In fact, FSTS held up rather well until 7 Jan 2016 where it suffered a 7 points drop. It closed at 398 on last Fri.
A break above 420 on a sustained basis negates the bearish tinge in the chart.
–> FSTS did not manage to break 420 hence the bearish tinge remains.
With reference to Chart 4 below, FSTS seems to be stronger on a relative basis. Firstly, FSTS’ did not form a lower low in Sep 2015 (vs Aug 2015) whereas S&P500, Hang Seng and STI did. Secondly, FSTS is still about 7 points away from its intraday low on 15 Dec 2015 low whereas both Hang Seng and STI are re-visiting Sep 2015 lows. We have to observe whether FSTS can successfully test the support of 391. A sustained break below 391 is negative.
Near term supports are at 394 / 391 / 386 – 389.
Near term resistances are at 399 / 401 – 403 / 407.
Chart 4: FSTS seems to be relatively stronger than STI

Source: CIMB chart as of 8 Jan 16
Conclusion
Over the past two weeks, I have taken profit on three stocks and bought more into my existing stocks. My current equity allocation is around 143%, up slightly since two weeks ago. (My clients have already been notified on 8 Jan via email what I am holding at the current moment.) I am likely to do some stock switching in the next two weeks.
Although the overall Singapore market continues to be challenging in 2016, I believe it can be a profitable year. In my opinion, there continue to be stocks listed on SGX with potential near term catalysts as long as we are diligent and do our homework. Please refer to my write-up on the overall market outlook in 2016 here.
As mentioned previously, readers who wish to be notified of my write-ups and / or informative emails, they can consider to sign up at http://ernest15percent.com so as to be included in my mailing list. However, this reader’s mailing list has a one or two-day lag time as I will (naturally) send information (more information, more emails and more details) to my clients first. For readers who wish to enquire on being my client, they can consider to leave their contacts here http://ernest15percent.com/index.php/about-me/
Lastly, I have met approximately 15 new clients over the past two weeks and some of them wonder how I screen and decide which companies to write. To understand more about my basis of deciding which companies to write, you can download a copy of my eBook available on my website http://ernest15percent.com.
Disclaimer
Please refer to the disclaimer here