STI has dropped 25.9% from its intraday high of 3,550 on 16 Apr 2015 to 2,631 on 15 Jan 2016. FTSE ST Small Cap Index (“FSTS”) fell 24.7% from its intraday high of 510 on 16 Apr 2015 to 384 on 15 Jan 2016. Since the start of 2016, STI and FSTS have fallen 8.7% and 5.0% respectively.
Other markets also suffered the same fate. U.S. faced the worst start of the year on record. Furthermore, with reference to Figure 1 below, U.S. is heading into the 4th consecutive quarterly drop in earnings.
Figure 1: U.S. past quarterly projections and actual earnings
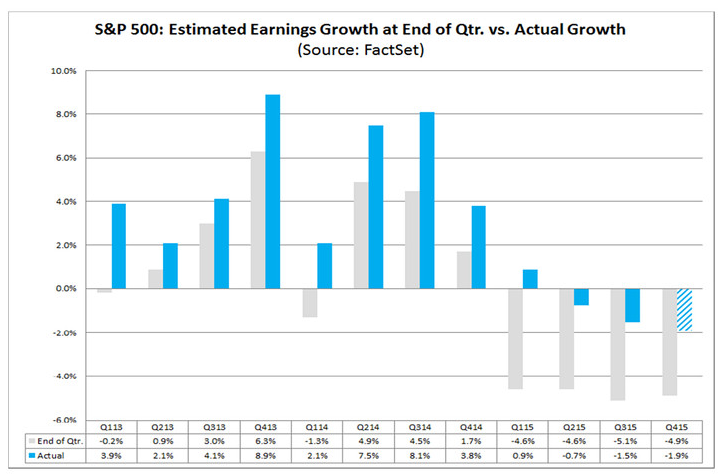
Source: Factsheet
Amid the global market selloff, there was ubiquitous news on how 2016 may be a year of financial crisis, the extent of which may rival that of the Global Financial Crisis (“GFC”) in 2008 / 2009. For example, RBS economists advise their clients in their Jan 2016 letter to “sell everything except high quality bonds” ahead of a possible stock market crash. JP Morgan analysts are also bearish and advise their clients “to sell on any bounce”.
Is Armageddon coming?
I have already pointed out the challenging conditions for our Singapore market at least for the 1H2016 in my write-up dated 1 Jan 2016. (See my write-up here) There are three things which are different now.
1. STI has fallen to > 2 standard deviations below the mean of the STI’s 12-month forward earnings.
According to DBS Vickers research, STI, at 2,650 is trading at approximately two standard deviations below the mean of the STI’s 12-month forward earnings. As STI closed at 2,631 last Fri, it is already trading more than 2 standard deviations. In addition, STI 1.0x P/BV is already below the Eurozone crisis in 2011 / 2012.
In view of the above, it should provide some downside support to the market in the event of further weakness.
2. Banks valuations have fallen lower than Europe crisis lows
Our three local banks are trading at three to four-year price lows. With reference to Table 1 below, it is noteworthy that DBS trades below its book value as of Fri’s closing. It is likely to be lower on Monday (at least at opening). DBS has suffered a larger drop amounting to -12.3% year to date. One of the possible reasons is that DBS, (according to an article in Bloomberg dated 6 Jan 2016), is one of the banks to be reportedly suspended from yuan trading by China. OCBC and UOB are not affected. According to the filings on SGX, DBS has not made any official announcement till date, thus, this may mean that there is immaterial impact to their financial results.
Table 1: Banks’ valuations vis-a-vis Eurozone and GFC lows
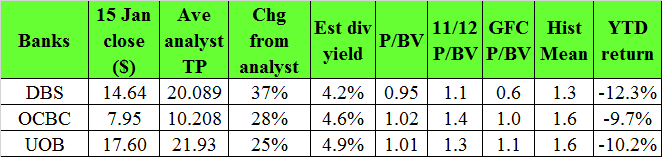
Source: Various
3. Selloff has sparked oversold pressures in various markets, stocks and various asset classes
From the start of this year through 13 Jan, US$3.2 trillion has been wiped out from the global markets. The amount is likely to be larger if we include the massive sell-down on 15 Jan. Such selloff has sparked oversold pressures in various markets, stocks and various asset classes.
For our Singapore market, using CIMB Securities complimentary stock filter, I have filtered out a list of 86 stocks whose RSI has dropped to below 30. Table 2 shows the list of top five stocks with the lowest RSI (i.e. most oversold)
Table 2: Top 5 oversold stocks sorted by RSI using CIMB Stock Filter
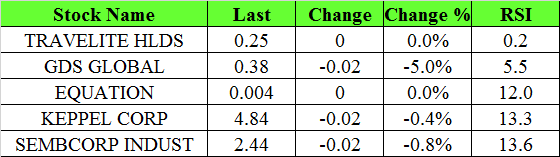
Source: CIMB complimentary stock filter
*Readers who wish to see the complete list of oversold stocks can either join as my clients via here, or sign up to be included in my website reader’s signup list. As mentioned previously, this reader’s mailing list has a one or two-day lag time as I will (naturally) send information (more information, more emails and more details) to my clients first.
My personal opinion is that there is no rule of thumb that we should buy the stock if its RSI is below a certain number. The oversold nature has to be viewed in context with the stock’s historical RSI and also on the specific news on the company and the sector. If the company, or the sector is facing significant headwinds, it may not rebound much in the event of a recovery in market sentiment. (For my clients, I have highlighted one stock not in the top five oversold stocks above, whose RSI is all time oversold since 1999 with generally still positive reviews on the stock.)
Conclusion
In a nutshell, STI and our three local banks’ low valuations should provide some downside support to the market in the event of further weakness. Furthermore, they are pretty oversold. Coupled with Monday’s likely “gap down”, oversold pressures should escalate and we may see some technical rebound in the near term. However, based on the current information and readings from chart, the technical rebound, if any, is unlikely to be a trend reversal.
Disclaimer
Please refer to the disclaimer here
Thanks-a-mundo for the article.Thanks Again. Great.