Dear readers,
Happy Chinese New Year! Hope you have had a great and enjoyable CNY celebration!
However, for our markets, it does not seem as joyous because Asian markets posted declines immediately after CNY. S&P500 plunged to touch a two-year low on 11 Feb 2016.
Read on to find out more on their technical outlooks…
S&P500 Index
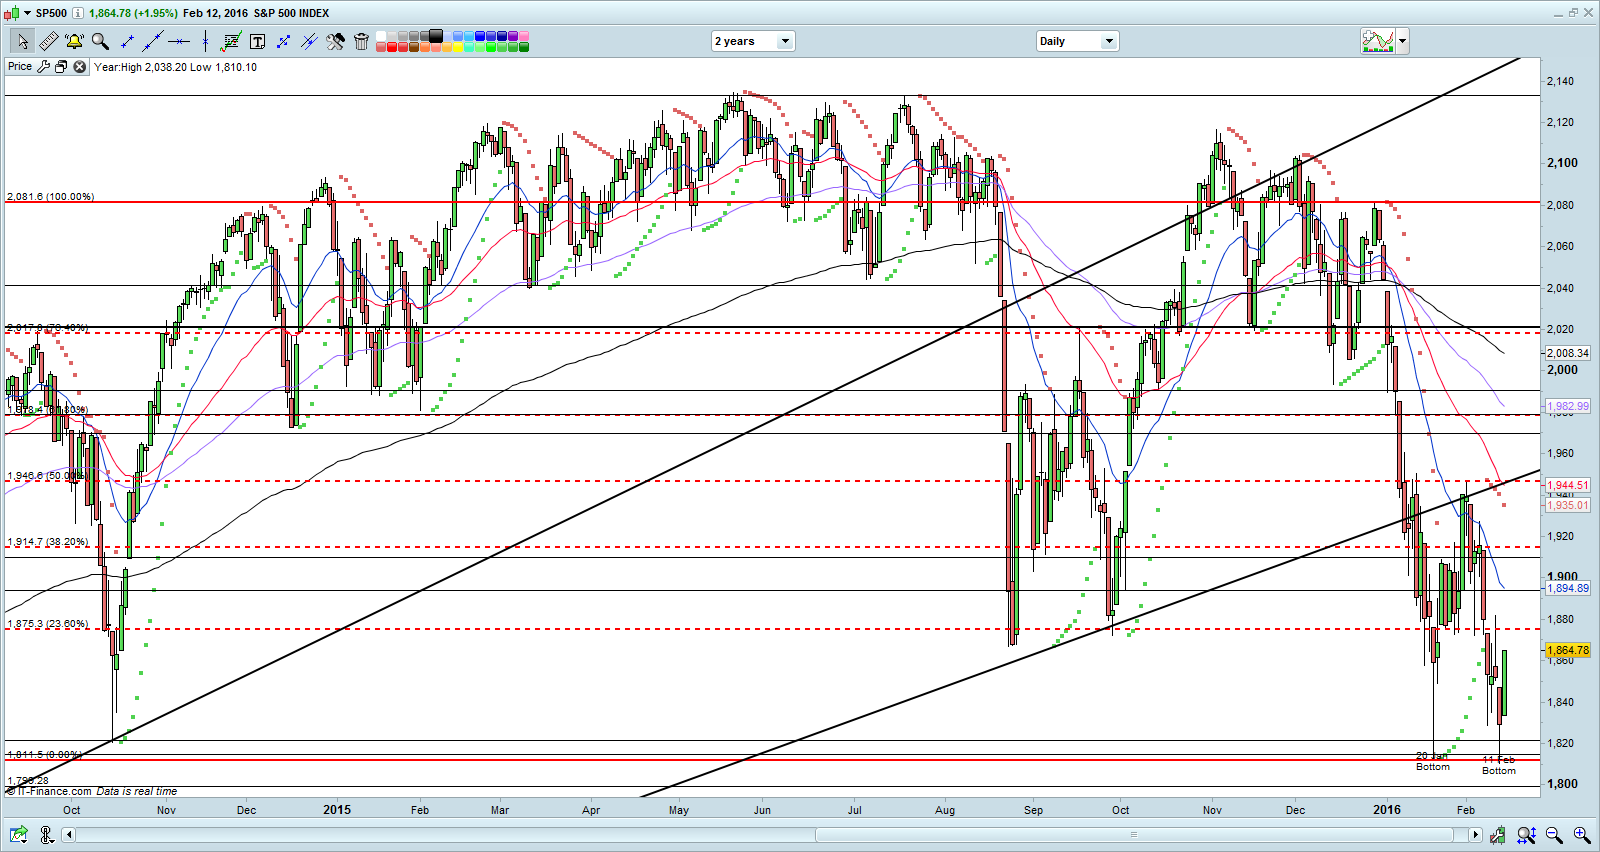
Just to recap what I have mentioned on 22 Jan 2016 (read here), I wrote “As the overall trend is bearish in the medium term, any rebound is likely to be short lived and arrested around the near term resistance region of around 1,940 – 1,946”
–> My chart analysis was spot on! In the technical rebound from 22 Jan to 1 Feb 2016, S&P500 first closed at 1,940 (day high) on 29 Jan 2016. It subsequently touched an intraday high of 1,947 on 1 Feb 2016 before the decline resumes to touch an intraday low at 1,810 on 11 Feb 2016.
Based on Chart 1 below, although S&P500 closed at day high 1,865 on last Fri, it is still in a strong downtrend with an elevated ADX at 36. As mentioned five weeks ago, the overall chart has turned bearish due to the formation of death crosses with a rising ADX. It is too early to say whether yesterday’s rally is a trend reversal. At this point, S&P500 seems to be trying to find its bottom. Despite the recent declines, S&P500 is not oversold yet.
As the overall trend continues to be bearish, any rebound is likely to meet with strong resistances at 1,893 – 1,900 and 1,940 – 1,946. Based on the current chart interpretation, the bearish outlook of the chart is negated with a sustained close above 1,950.
Near term supports: 1,810 – 1,812 / 1,800 / 1,775
Near term resistances are around 1,872 -1,875 / 1,893 – 1,900 / 1,915
Chart 1: S&P500 plunged to a two-year low
Source: CIMB chart as of 12 Feb 2016
Hang Seng Index
On 22 Jan 2016, I mentioned that “The medium term outlook on Hang Seng’s chart continues to be bearish. The break below 20,305 points to a measured eventual technical target of 17,180. This represents potential but does not mean it’s a definite outcome”
–> Hang Seng continues to be weak as it has dropped another 761 points to close at 18,320 on 12 Feb 2016.
The medium term outlook on Hang Seng’s chart continues to be bearish. All the exponential moving averages (“EMAs”) continue their decline against an elevated ADX of around 36.4. RSI closed at 33.1 on last Fri which is not oversold. Although the break below 20,305 points to a measured eventual technical target of 17,180, it represents potential but does not mean it’s a definite outcome. Meanwhile, the close on last Fri may represent an inverted hammer. However, we need to see a gap up / a long up candle, followed by buying over the next few days to indicate a near term bottom may have been reached.
The strong bearish chart outlook may be alleviated to a certain extent if Hang Seng can close above the 19,850 on a sustained basis. (See Chart 2 below).
Near term supports: 18,040 / 17,860 / 17,613
Near term resistances: 18,765 / 19,166 / 19,411 – 19,482
Chart 2: Hang Seng – potential inverted hammer
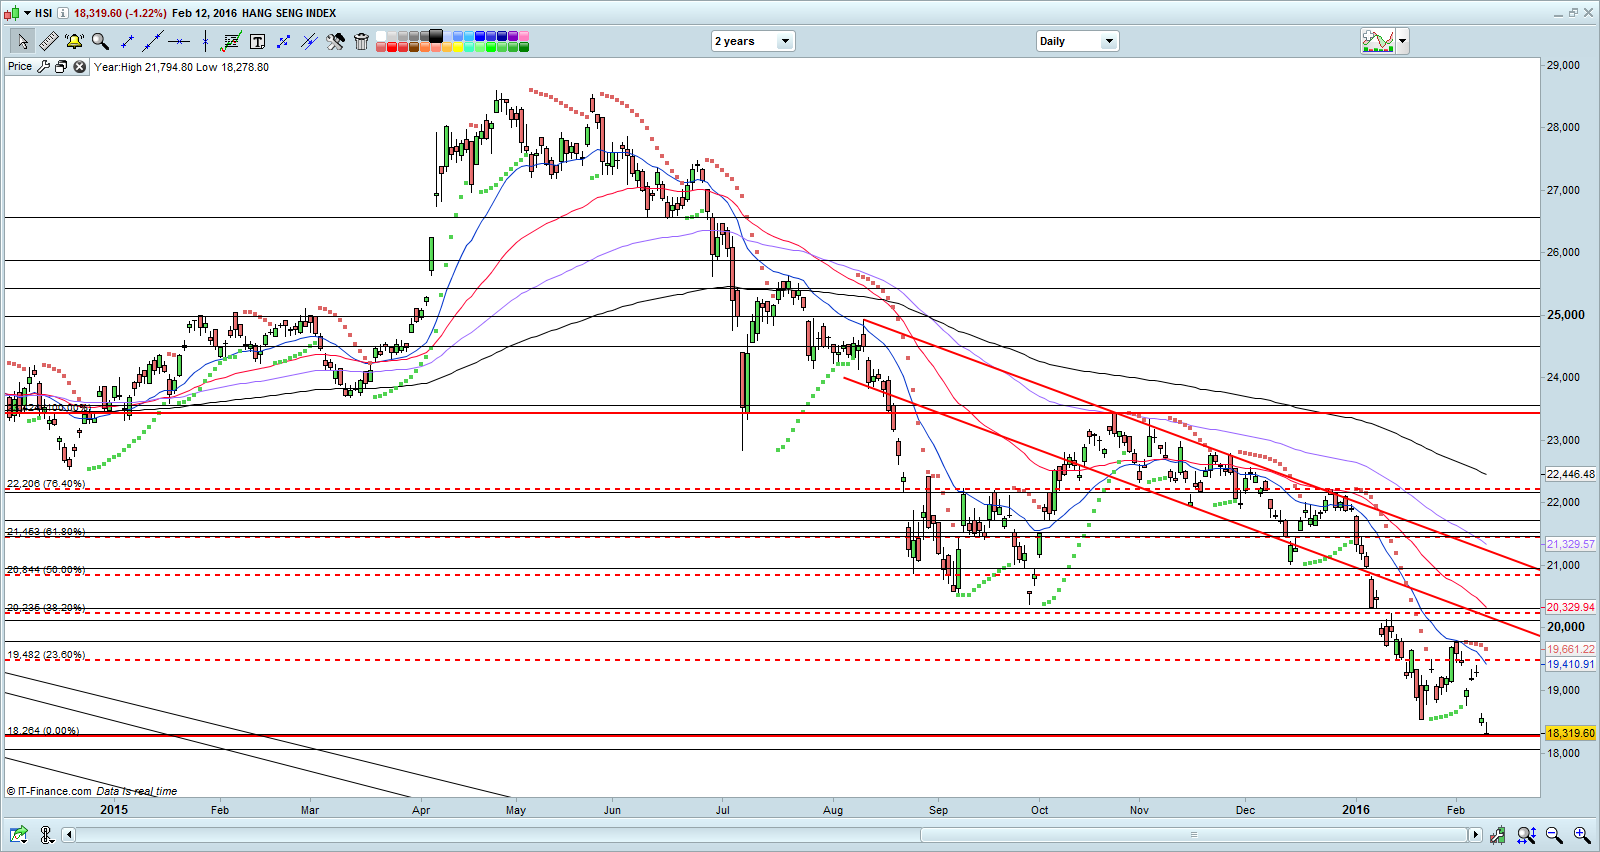
Source: CIMB chart as of 12 Feb 2016
STI Index
On 22 Jan 2016, I wrote that “There may be short term technical rebound but it is likely to meet with considerable resistance at 2,698 – 2,740 (likely 2,698) and is unlikely a trend reversal”
–> In the technical rebound from 22 Jan to 1 Feb 2016, STI closed at 2,629 (1st resistance previously mentioned) and touched an intraday high of 2,645 on 1 Feb before the decline resumes to touch an intraday low at 2,528 on 3 Feb 2016.
STI closed at 2,540 on 12 Feb 2016. STI seems to be trading within 2,528 – 2,645 since 19 Jan 2016 and it is a good sign that despite the carnage seen in the U.S., European, Japan and Hong Kong, STI did not breach below 2,528 (3 Feb low). However, STI is at the lower end of the trading range now. The medium term trend remains clearly down for now. A sustained break above 2,645 should alleviate some of the bearishness in the chart to a certain extent. It is noteworthy that a break below / above 2,528 / 2,645 will point to an eventual measured technical target of 2,411 / 2,762. (See Chart 3 below)
Near term supports: 2,528 / 2,498 – 2,500 / 2,436
Near term resistances: 2,572 / 2,608 / 2,631 – 2,633
Chart 3: STI has been range trading 2,528 – 2,645 since 19 Jan 2016
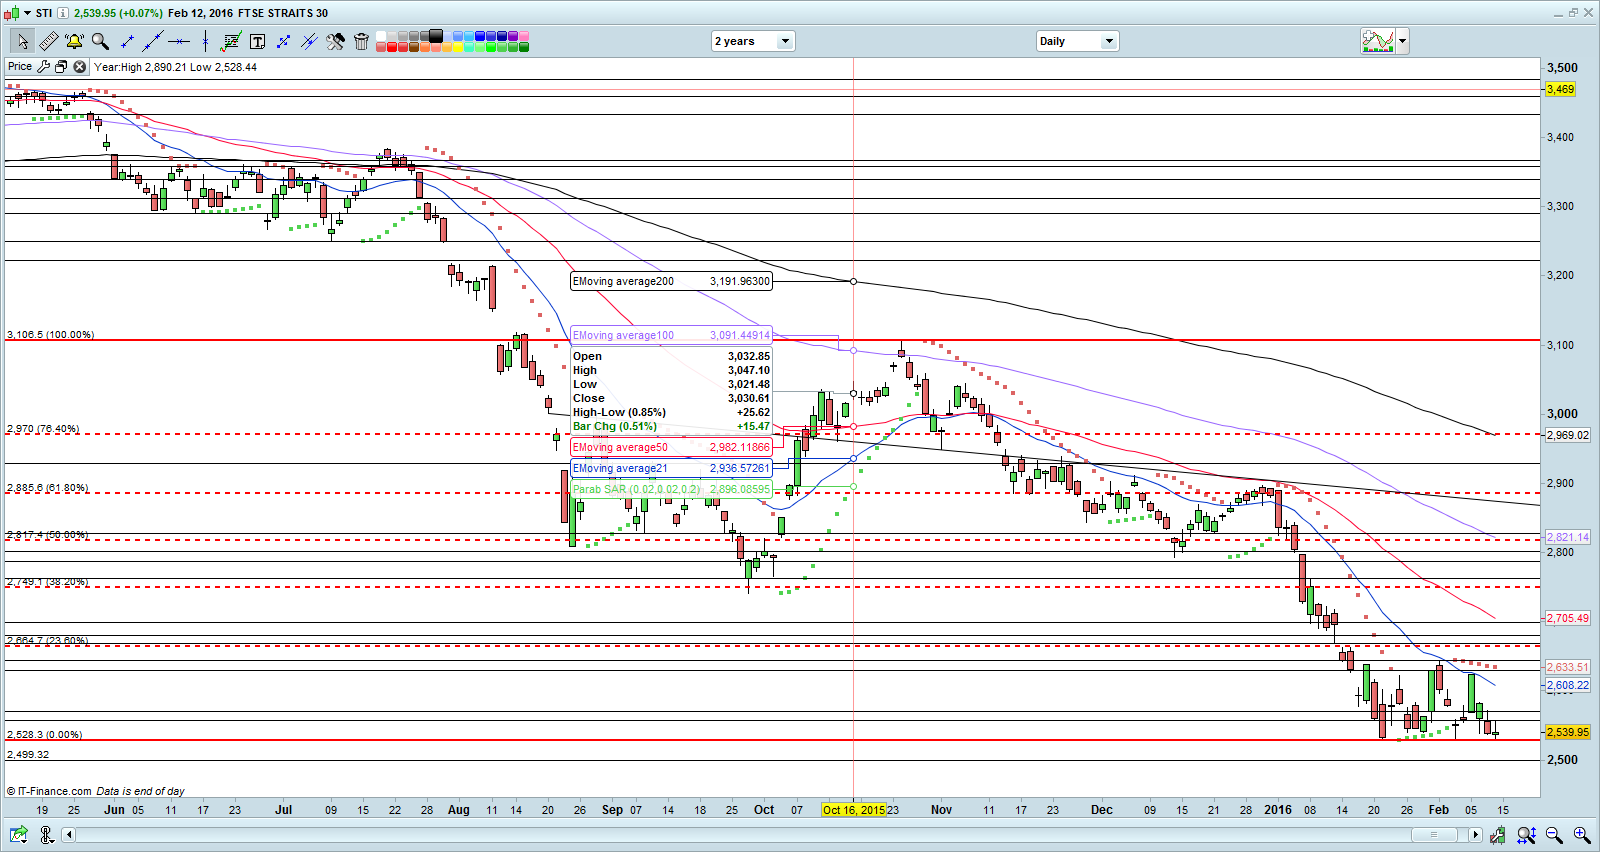
Source: CIMB chart as of 12 Feb 2016
FTSE ST Small Cap Index (“FSTS”)
On 22 Jan 2016, I wrote that “FSTS’ indicators such as RSI and MACD have exhibited bullish divergence. Notwithstanding FSTS’ greater relative strength vs STI, FSTS’ overall chart continues to be on a downtrend.”
–> Notwithstanding the slide in the global markets, FSTS still traded around 371 which was the low seen on 21 Jan 2016. Thus, it has been pretty resilient.
With reference to Chart 4 below, FSTS’ indicators such as RSI and MACD continue to exhibit bullish divergence. ADX continues to be high at 35.4 but has already dropped from 38.0 on 22 Jan 2016. A sustained break below 368 is negative whereas a sustained break above 381 should reduce some of the bearishness to a certain extent.
Near term supports are at 368 / 365 / 358.
Near term resistances are at 377 / 379 – 381 / 388 – 389.
Chart 4: FSTS’ RSI and MACD continue to exhibit bullish divergence
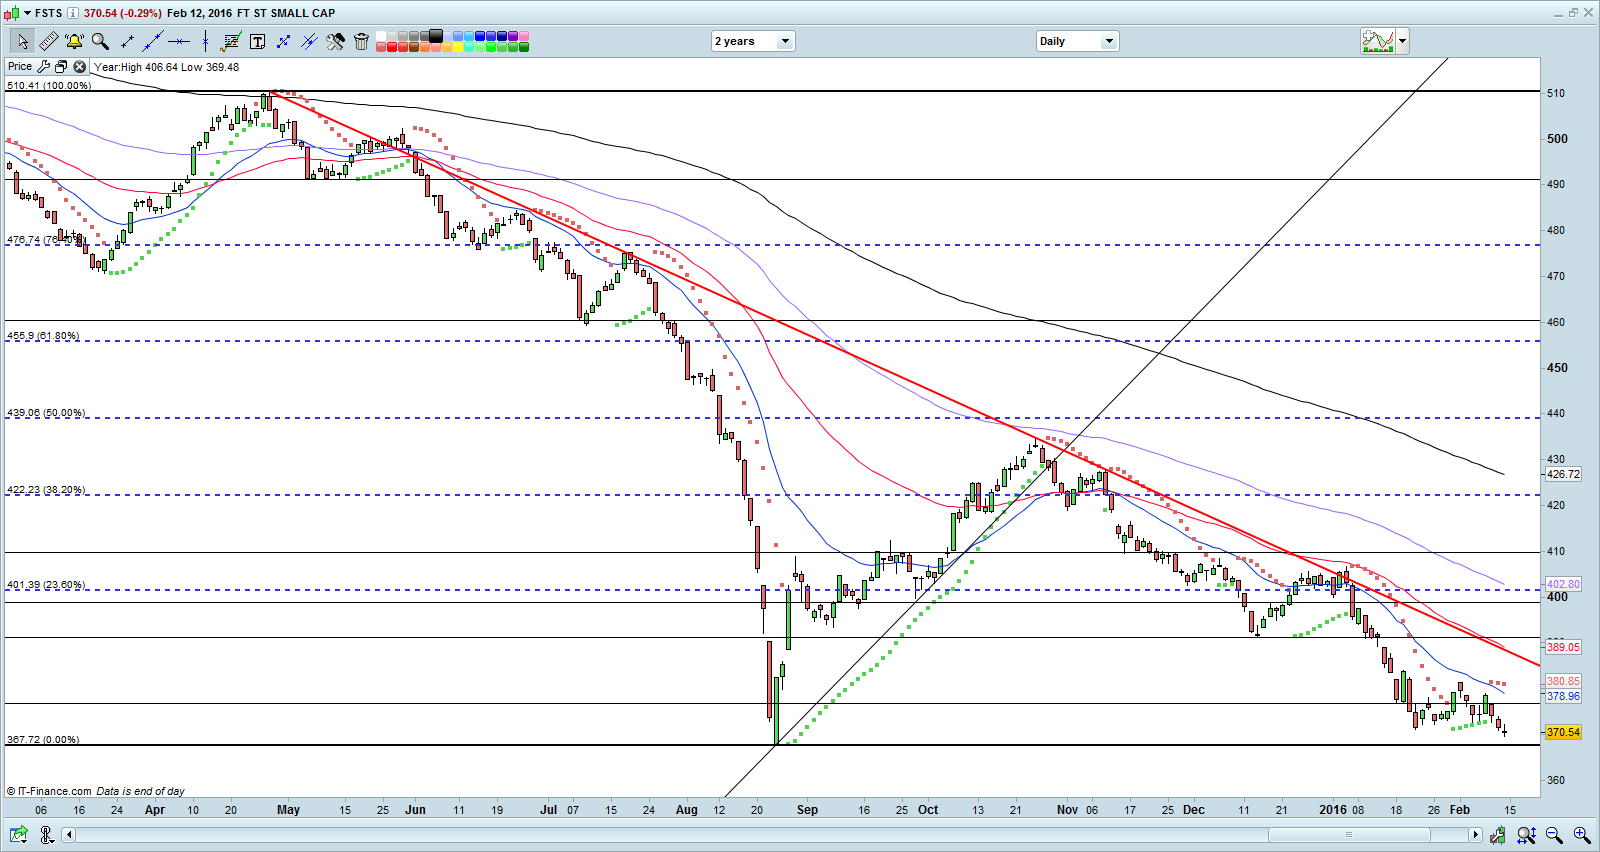
Source: CIMB chart as of 12 Feb 2016
Conclusion
For the past three weeks, I have taken profit on some stocks and bought some stocks in anticipation of their results. Despite the market weakness and general overall pessimism on the overall market, I still and do believe that that there are stocks with near term catalysts with favourable risk reward setups. Notwithstanding this, I have since reduced my allocation from 158% to approximately 128% as I have taken profit on my largest stock holding approximately 2-3 weeks ago. (My clients have been notified on 14 Feb via email on what I am holding at the current moment.) I am likely to reduce my equity allocation in the next 1-4 weeks as I am looking to sell some stocks on or around their results’ release.
As mentioned previously, readers who wish to be notified of my write-ups and / or informative emails, they can consider to sign up at http://ernest15percent.com so as to be included in my mailing list. However, this reader’s mailing list has a one or two-day lag time as I will (naturally) send information (more information, more emails and more details) to my clients first. For readers who wish to enquire on being my client, they can consider to leave their contacts here http://ernest15percent.com/index.php/about-me/
Lastly, many new clients have asked me how I screen and decide which companies to take a closer look / write. To understand more about my basis of deciding which companies to write, you can download a copy of my eBook available on my website here.
Disclaimer
Please refer to the disclaimer here