Dear readers,
With reference to my write-up on 11 Mar 2016 (see here), S&P500 has been pretty stable lately without a swing of 1% for the past two weeks. Similarly, our Asian markets have been trading within tight ranges. What’s next for our markets?
Read on to find out more.
S&P500 Index
Just to recap what I have mentioned on 11 Mar 2016 (see here), I wrote “S&P500 is likely to take a breather and trade within the range of 1,950 – 2,044 in the next two weeks, after forming a bullish double bottom formation with an eventual measured technical target of around 2,080.”
–> S&P500 continued to climb from 2,022 on 11 Mar 2016 to touch an intraday high of 2,057 on 22 Mar 2016, before profit taking sets in and S&P500 closed at 2,036 on 24 Mar 2016.
Based on Chart 1 below, S&P500 recent rally was accompanied with weaker than average volume. 21D exponential moving average (“EMA”) has just formed a golden cross with 200D EMA. ADX started to climb from 16.4 on 11 Mar 2016 to 22.0 on 24 Mar 2016. Indicators such as RSI and MACD have declined with RSI closing at 63 on 24 Mar 2016 (from 65 on 11 Mar 2016). The eventual measured technical target of around 2,080 remains valid as long as 1,970 is not broken. It is noteworthy that a break below 1,950 on a sustained basis negates the bullish tinge in the chart.
Near term supports: 2,018 – 2,022 / 2,004 – 2,006 / 1,981 – 1,987
Near term resistances are around 2,057 / 2,080 – 2,082 / 2,104
Chart 1: S&P500 volatility has declined without a swing of 1% for the past two weeks

Source: CIMB chart as of 24 Mar 2016
Hang Seng Index
On 11 Mar 2016, I mentioned that “Hang Seng seems to have staged a bullish break above 19,784 with an eventual technical measured target is around 21,026. In the next two weeks, Hang Seng is likely to trade within a range of 19,500 – 20,750 in the next two weeks. A sustained break below 19,500 negates the slight bullish tinge in the chart.”
–> Hang Seng indeed traded in a tight trading range between 20,169 – 20,773 for the past nine trading days. It closed at 20,346 on last Thurs.
Based on Chart 2 below, Hang Seng seems to have slid back to the upper trend line. ADX continues to remain at low levels and closed at 17.5 on 24 Mar 2016, indicative of a lack of trend. Both RSI and MACD have retreated from four month high levels. Hang Seng is likely to trade within a range of 19,500 – 20,850 in the next two weeks. A sustained break below 19,500 negates the slight bullish tinge in the chart
Near term supports: 20,115 – 20,325 / 19,800 / 19,500
Near term resistances: 20,500 / 20,775 / 20,850
Chart 2: Hang Seng continues to trade within tight range
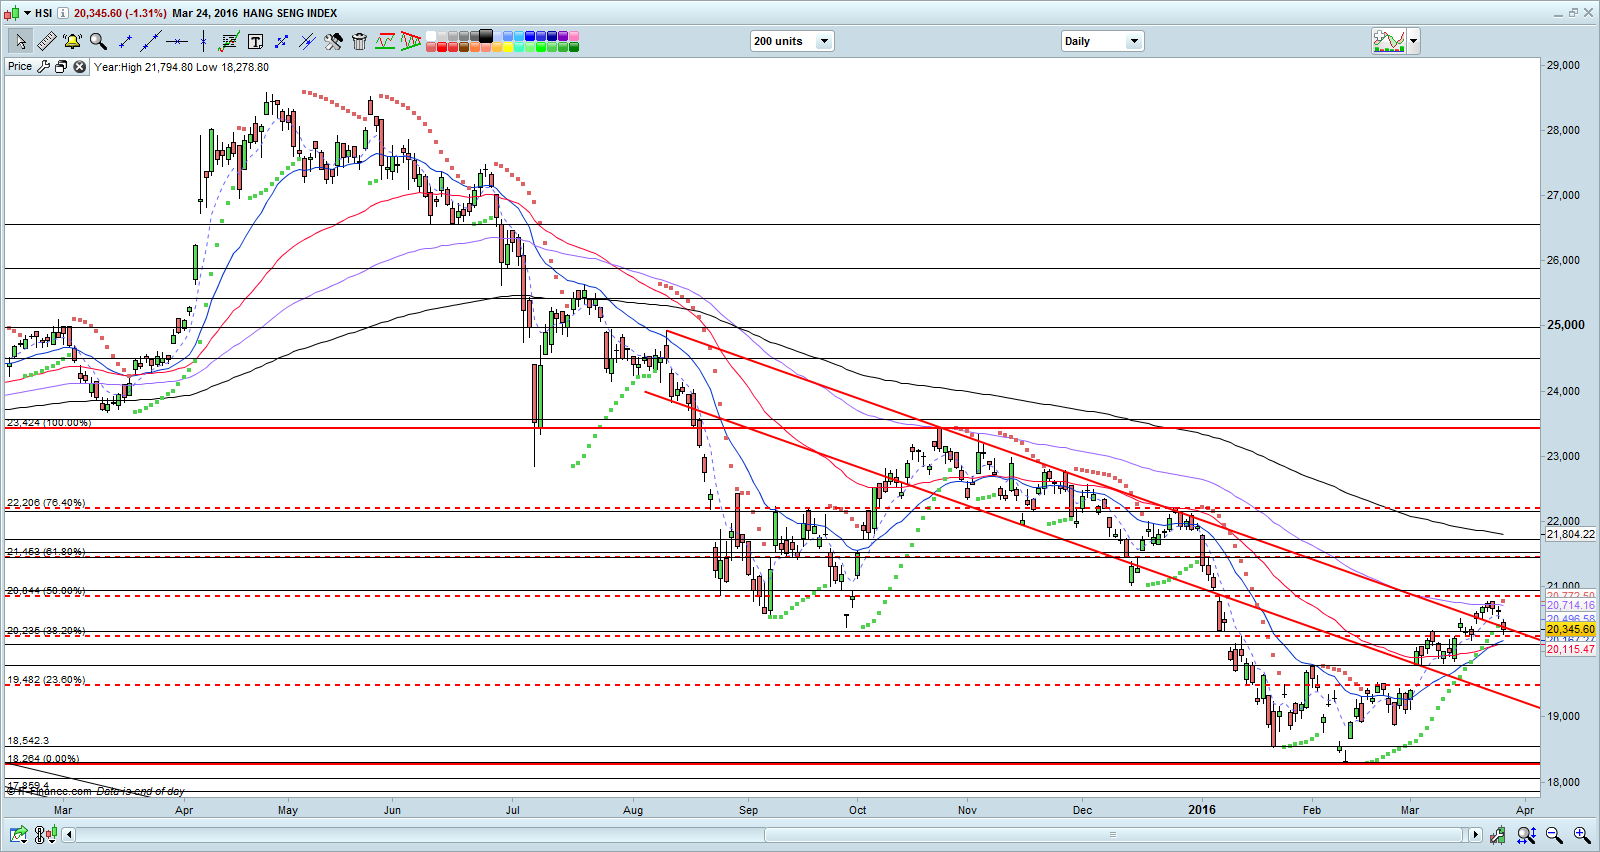
Source: CIMB chart as of 24 Mar 2016
STI Index
On 11 Mar 2016, I wrote that “RSI hit 70 on 4 Mar which was an 11 month high and closed at 65 on 11 Mar. MACD closed at 45.9, the highest level since July 2012. ADX climbed from 20.9 on 26 Feb to 25.4 on 11 Mar. It would be good if STI can consolidate first before pushing higher.”
–> STI seemed to be consolidating its recent hefty gains. It traded between 2,829 – 2,907 for the past two weeks.
Based on Chart 3 below, STI 21D EMA has just formed a golden cross with its 100D EMA. Both RSI and MACD have retreated. ADX climbed from 25.4 on 11 Mar to 28.8 on 24 Mar. Although the medium term trend seems to be on an uptrend, I noticed that our local banks and Singtel seem to be consolidating their recent hefty gains. It is likely that STI may consolidate between the range of 2,700 – 2,920 in the next two weeks. STI closed at 2,847 on last Thursday. A break below 2,700 negates the bullish tinge in the chart.
Near term supports: 2,827 / 2,808 / 2,800
Near term resistances: 2,866 / 2,885 / 2,907
Chart 3: STI – consolidation phrase
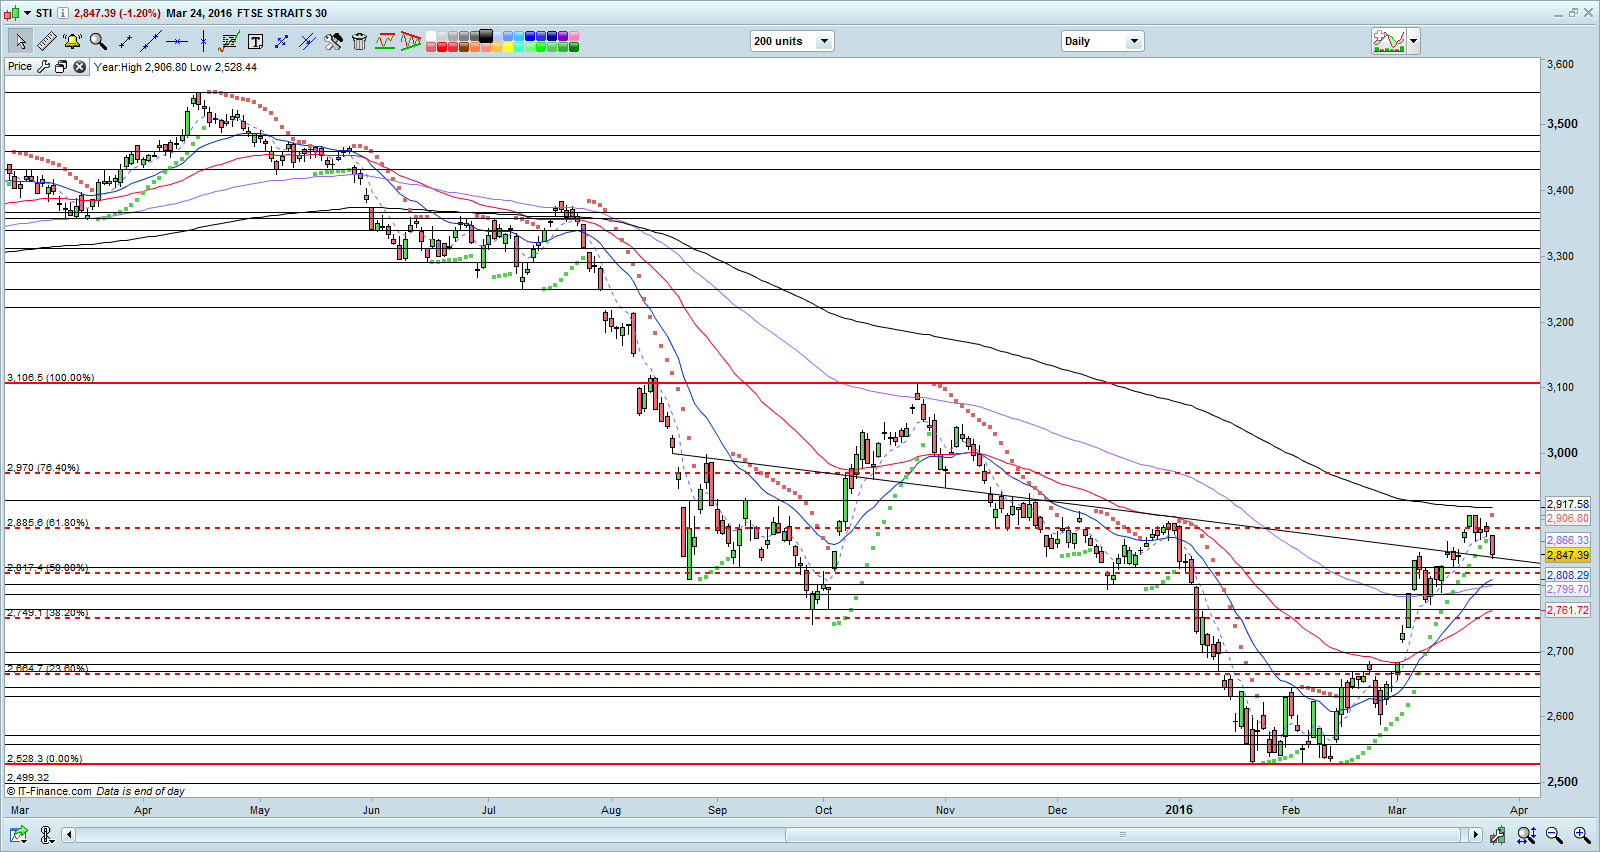
Source: CIMB chart as 24 Mar 2016
FTSE ST Small Cap Index (“FSTS”)
On 11 Mar 2016, I wrote that “FSTS should face some strong resistance around 405 – 410 in the near term. It would be good if we can see some consolidation on the FSTS before it continues ascent. A sustained break below 390 negates the bullish tinge in the chart.”
–> FSTS touched my aforementioned strong resistance of 405 and declined 1.7% to close at 398.
Based on Chart 4 below, FSTS meets strong resistance of around 405 and I have seen some profit taking take place. It remains to be seen whether FSTS may break the supports at 394 – 397. A sustained break below 390 negates the bullish tinge in the chart.
Near term supports are at 397 / 394 / 390.
Near term resistances are at 401 / 405 / 410
Chart 4: FSTS – needs to observe whether it breaks the supports at 394 – 397
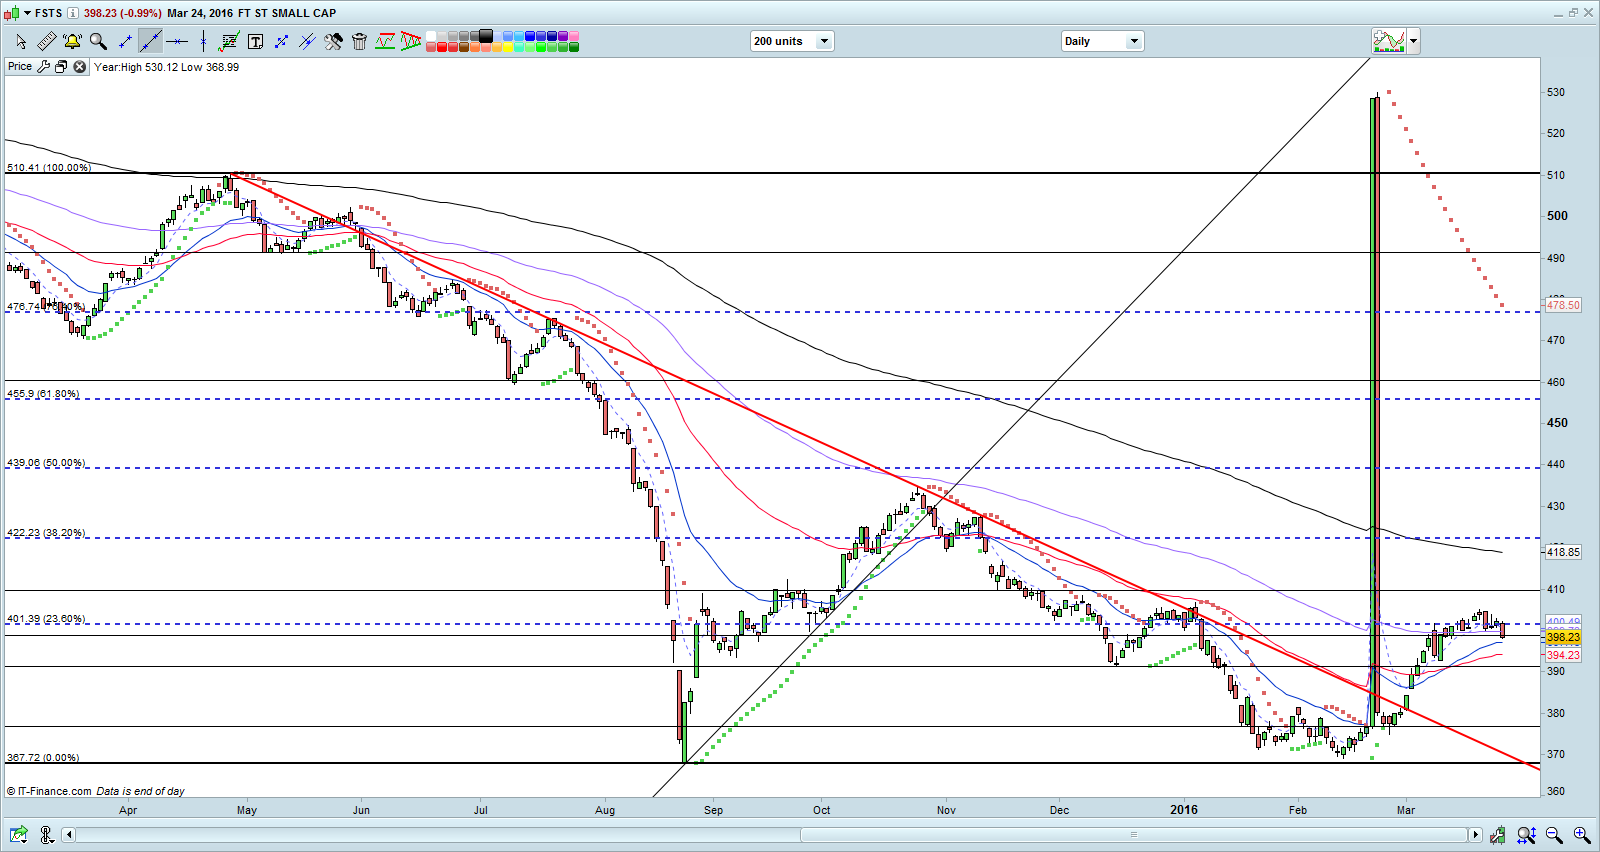
Source: CIMB chart as of 24 Mar 2016
Conclusion
Markets have had a good run for the past six weeks with the last week registering a 2% drop. Since 12 Feb, STI has risen almost 315 points or 12.4% from 2,532 to 2,847 on last Thursday. Since two weeks ago, I have already reduced my % invested to 0% on 24 Mar.
Why am I in cash now?
a) Markets have had a good run. According to OCBC Research, S&P500 trades at 18.3x PE and 2.8x P/B which are 0.9x standard deviation above its 10-year average. Amid an uncertain earnings and global economy outlook, S&P500 may find it difficult to breach above 2,080 in the near term.;
b) Next two weeks will see a raft of important data released. For example, some market moving data include corporate results from Chinese Banks; Federal Reserve Chair Janet Yellen speaks on 29 Mar 2016; China’ PMIs / U.S. jobs report on 1 Apr 2016; FOMC minutes on 6 Apr 2016 etc;
c) Oil prices may find it difficult to continue rising. S&P500 has recently been trading in lockstep with oil with a correlation of as high as 0.90. For the past few trading sessions, oil has started to weaken and we should see some near term consolidation after jumping 50% from its 12-year low reached last month;
d) Our Singapore stocks have mostly released their latest corporate results. Except for the dividends to be XD in Apr / May, there may not be any near term catalysts for most companies;
e) The recent indiscriminate buying of penny stocks seems frothy to me. Some small caps have started to tumble such as OKH Global, Sysma etc. Hot punting favorites such as Ezra, Yuuzoo have not made new highs either. I prefer to err on the side of caution;
In view of the above, I have turned 100% in cash since 2nd week of Mar. Nevertheless, I am not going to be forever out of the market. I am looking to accumulate some stocks on weakness and depend on company updates. I may also enter into either long or short positions for tactical trading purposes. (My clients will be duly informed on new stocks which I have entered.)
As mentioned previously, readers who wish to be notified of my write-ups and / or informative emails, they can consider to sign up at http://ernest15percent.com so as to be included in my mailing list. However, this reader’s mailing list has a one or two-day lag time as I will (naturally) send information (more information, more emails and more details) to my clients first. For readers who wish to enquire on being my client, they can consider to leave their contacts here http://ernest15percent.com/index.php/about-me/
Lastly, many new clients have asked me how I screen and decide which companies to take a closer look / write. To understand more about my basis of deciding which companies to write, you can download a copy of my eBook available on my website here.
P.S: Do note that as I am a full time remisier, I can change my equity allocation fast to capitalize on the markets’ movements.
Disclaimer
Please refer to the disclaimer here
Really enjoyed this post.Much thanks again. Fantastic.