Dear readers,
As I correctly pointed out on 21 Mar, Mon 907am to my clients via email to alert them to consider taking profit on our local banks, the three local banks have fallen -3.9% – 6.4%, vis-à-vis a 3.4% drop in the STI. It is noteworthy that 18 Mar close was coincidentally a recent high for STI.
For the past two weeks despite the lackluster market, it has been an exciting and profitable fortnight for me as I have increased from 0% invested on 24 Mar 2016 to 90+% invested and back to 0% invested as of 8 Apr.
What’s next for our markets?
Read on to find out more.
S&P500 Index
Just to recap what I have mentioned on 24 Mar 2016 (see here), I wrote “S&P500 recent rally was accompanied with weaker than average volume. The eventual measured technical target of around 2,080 remains valid as long as 1,970 is not broken. It is noteworthy that a break below 1,950 on a sustained basis negates the bullish tinge in the chart.”
–> S&P500 has reached my measured technical target of 2,080 (+/- a few points) which I pointed out in my 26 Feb 2016 Ernest’s market outlook. S&P500 traded to a high of 2,075 on 1 Apr 2016 before profit taking set in and it closed 2,048 on 8 Apr 2016.
Based on Chart 1 below, S&P500’s 1% movement on 5 Apr, 6 Apr & 7 Apr shattered its 15-day stretch of calm, the longest since March 2015. ADX continued to slide from 22.0 on 24 Mar 2016 to 19.8 on 8 Apr 2016, indicative of a lack of trend. Both RSI, MACD and MFI have declined. It is likely that S&P500 may consolidate between 1,980 – 2,080 with a downward bias. A break below 1,980 on a sustained basis negates the bullish tinge in the chart.
Near term supports: 2,036 / 2,018 – 2,021 / 2,000 – 2,009
Near term resistances are around 2,074 / 2,080 – 2,082 / 2,104
Chart 1: S&P500 turned volatile in the past four trading days
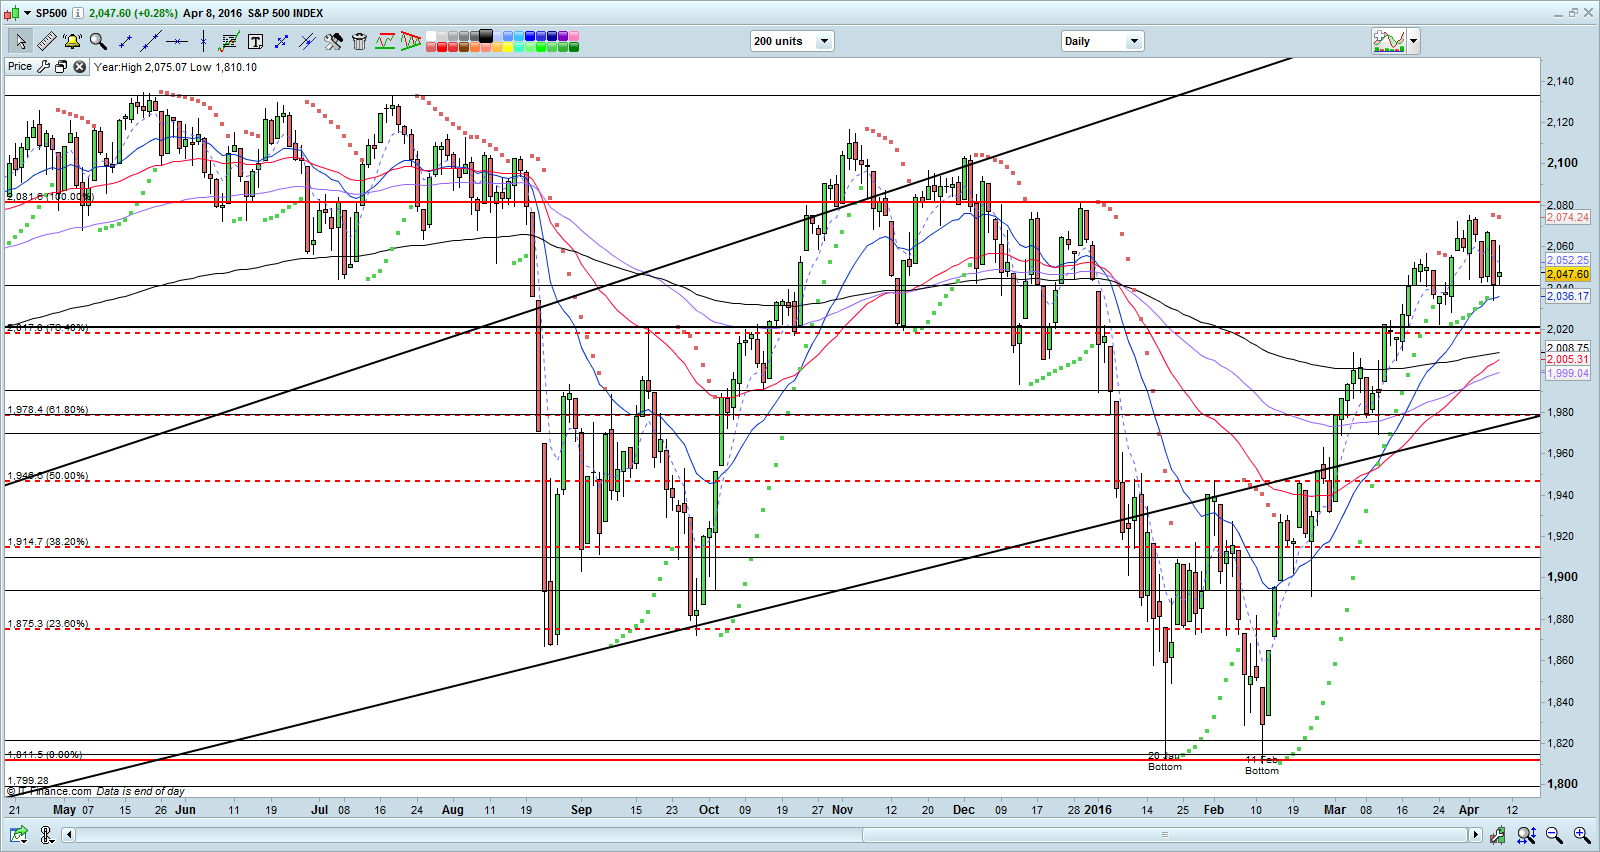
Source: CIMB chart as of 8 Apr 2016
Hang Seng Index
On 24 Mar 2016, I mentioned that “Hang Seng is likely to trade within a range of 19,500 – 20,850 in the next two weeks amid low ADX, softening RSI and MACD.”
–> Hang Seng indeed traded in a tight trading range between 20,046 – 20,873 for the past two weeks. It closed at 20,370 on last Fri.
Based on Chart 2 below, it is similar to the prognosis two weeks ago. Hang Seng seems to have slid back to the upper trend line. ADX dipped lower from 17.5 on 24 Mar 2016, to close at 13.6 on 8 Apr 2016, indicative of a lack of trend. Both RSI and MACD have weakened further in the past two weeks. Hang Seng is likely to trade within a range of 19,500 – 20,950 in the next two weeks. A sustained break below 19,500 negates the slight bullish tinge in the chart
Near term supports: 19,800 / 19,500 / 19,193
Near term resistances: 20,500 / 20,672 / 20,850
Chart 2: Hang Seng likely range bound
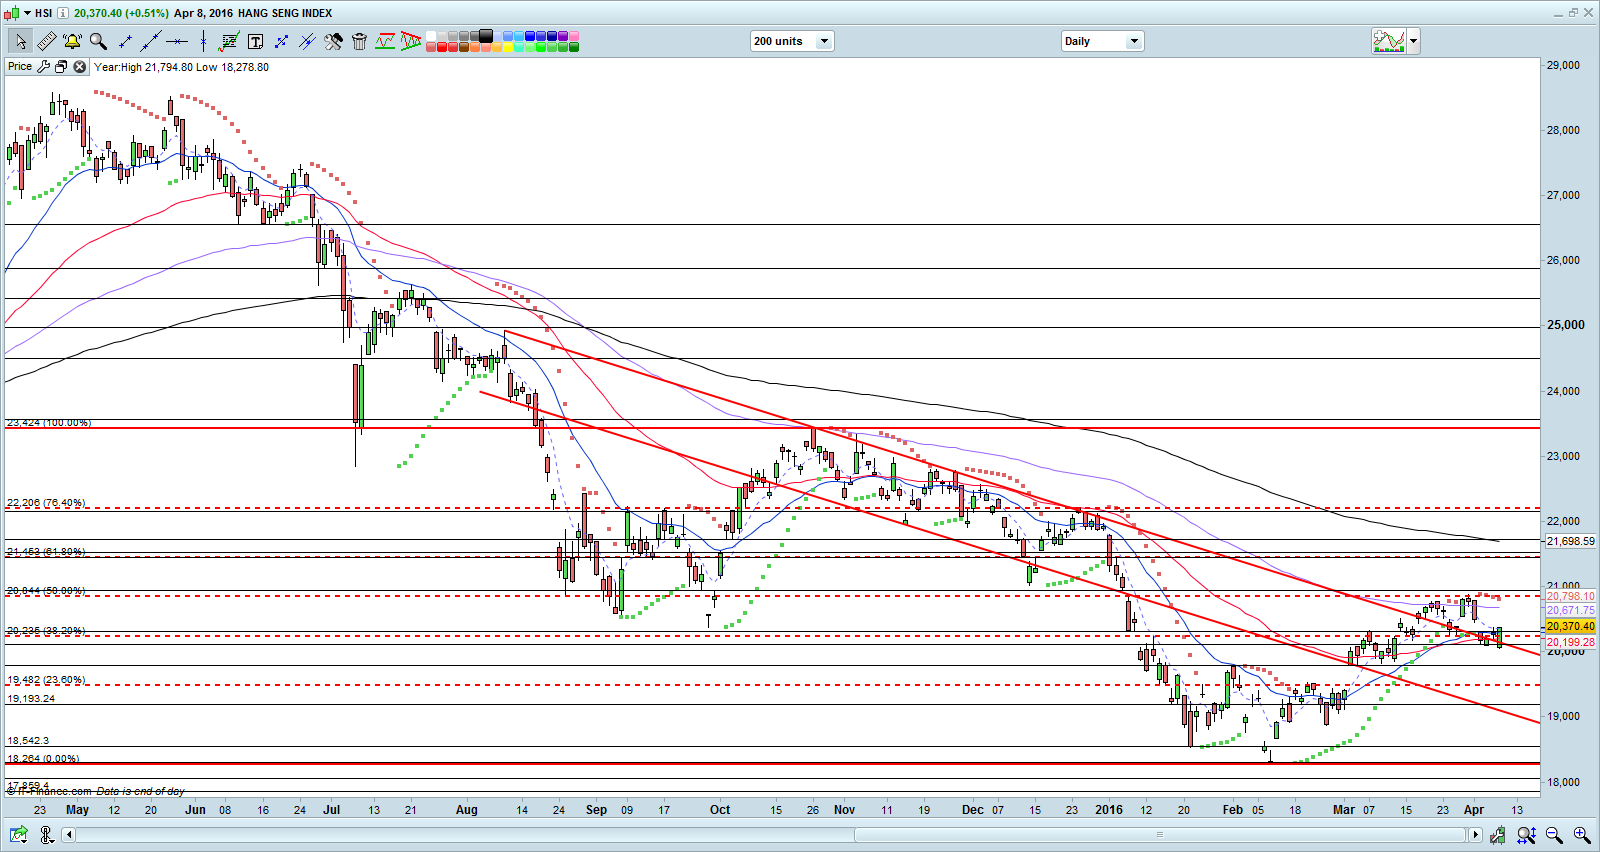
Source: CIMB chart as of 8 Apr 2016
STI Index
On 24 Mar 2016, I wrote that “Although the medium term trend seems to be on an uptrend, I noticed that our local banks and Singtel seem to be consolidating their recent hefty gains. It is likely that STI may consolidate between the range of 2,700 – 2,920 in the next two weeks.”
–> As I correctly pointed out, our local banks and Singtel have declined between -0.6% to -2.9% for the past two weeks, vis-à-vis a 1.4% decline in the STI. Clients should not be surprised as they would have received my email on 21 Mar, Mon 907am to inform them that our local banks have surged since 12 Feb and they should consider taking some profits. It is noteworthy that 18 Mar close was coincidentally a recent high for STI. (See Table 1 below)
Table 1: Banks’ and Singtel’s price change for the past two weeks

Source: Ernest’s compilations as of 8 Apr 16
Based on Chart 3 below, both RSI and MACD have continued to soften. ADX declined from 28.8 on 24 Mar 2016 to 17.9 on 8 Apr 2016, indicative of a lack of trend. Similar to two weeks ago, STI continues to be in a consolidation phrase 2,700 – 2,909 with a downward bias. STI closed at 2,808 on last Fri. A break below 2,700 negates the bullish tinge in the chart.
Near term supports: 2,782 / 2,750 / 2,700
Near term resistances: 2,817 / 2,850 / 2,872
Chart 3: STI continues to consolidate with a downward bias

Source: CIMB chart as 8 Apr 2016
FTSE ST Small Cap Index (“FSTS”)
On 24 Mar 2016, I wrote that “FSTS saw some profit taking around 405. It remains to be seen whether FSTS may break the supports at 394 – 397.”
–> FSTS continued to trade around the support level of 394. It closed at 396 on 8 Apr 2016.
Based on Chart 4 below, FSTS seemed to have peaked at 405 on 18 Mar 2016 and is now trading near the lower end of the trading range of around 391 – 405. Both MACD and RSI have softened. In the next two weeks, FSTS may consolidate with a downward bias. A break below / above 391 / 405 points to a measured technical target of 377 / 419 respectively.
Near term supports are at 394 / 390 – 391 / 384 – 386.
Near term resistances are at 399 / 401 / 405
Chart 4: FSTS – may consolidate with a downward bias
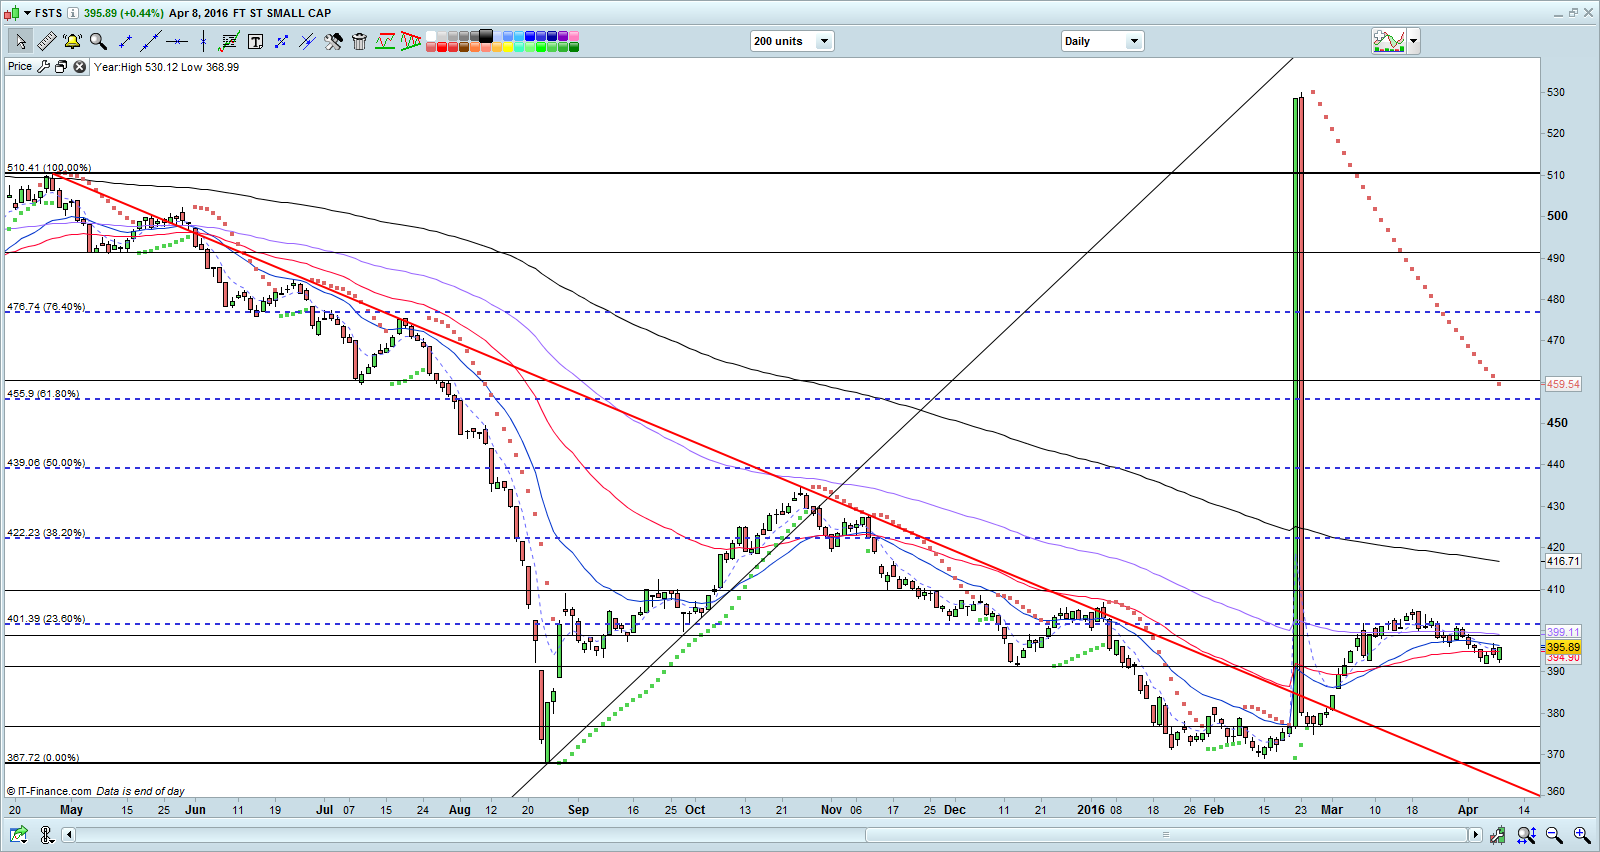
Source: CIMB chart as of 8 Apr 2016
Conclusion
These two weeks have been exciting and profitable for me, despite a 1.4% drop in STI. I have raised my percentage invested from 0% on 24 Mar to 90+% invested by buying into three stocks (yes, I usually have a very concentrated portfolio). By 8 Apr 2016, I have taken profit on three stocks and have reduced my percentage invested back to 0%!
In the next two weeks, I am likely to buy a couple of stocks but am unlikely to exceed 50% invested as I am cautious for the next two weeks. (My clients will be duly informed on new stocks which I have entered and any significant portfolio change.) Besides my usual reasons which I have written in my previous market outlook write-ups, I like to add the following:
a) U.S. 1Q corporate results commences next week. According to FactSet estimates, S&P500 earnings are expected to slump 8.5% (Ex energy, 3.7% decline), the worst quarterly period since 3Q2009. Furthermore, if the estimates are accurate, this will mark the 1st time in seven years that S&P500 has registered four consecutive quarters of decline. Examples of corporate earnings release this week are Alcoa (Mon), JP Morgan (Wed), Bank of America (Thurs) and Citigroup (Fri).
b) Some important data to watch are the Fed’s unexpected meeting to discuss rates on 11 Apr, Mon; IMF economic outlook on Tues and China’s GDP on Fri.
As mentioned previously, readers who wish to be notified of my write-ups and / or informative emails, they can consider to sign up at http://ernest15percent.com so as to be included in my mailing list. However, this reader’s mailing list has a one or two-day lag time as I will (naturally) send information (more information, more emails and more details) to my clients first. The above email on 21 Mar 2016 to alert clients to consider taking profit on our local banks was a case in point. For readers who wish to enquire on being my client, they can consider to leave their contacts here http://ernest15percent.com/index.php/about-me/
Lastly, many new clients have asked me how I screen and decide which companies to take a closer look / write. To understand more about my basis of deciding which companies to write, you can download a copy of my eBook available on my website here.
P.S: Do note that as I am a full time remisier, I can change my equity allocation fast to capitalize on the markets’ movements.
Disclaimer
Please refer to the disclaimer here
Just read your full page ST interview.
I must say that I am very impressed just with your stock approach principles.
How do I become your client and to be duly updated with your stock assessments?
Thank you
Hi John, thanks for dropping your contacts on my website. I have already replied you.
Thanks for another wonderful post. The place else could anyone get that type of information in such an ideal means of writing? I’ve a presentation subsequent week, and I am at the search for such info.