Dear readers,
Despite the mostly disappointing results, S&P500 is about 2% below its all-time high. Will S&P500 continue to march higher and breach its all-time high of 2,135?
Read on to find out more.
S&P500 Index
Just to recap what I have mentioned on 8 Apr 2016 (see here), I wrote “S&P500 may consolidate between 1,980 – 2,080 with a downward bias. A break below 1,980 on a sustained basis negates the bullish tinge in the chart.”
–> S&P500 breached 2,080 on 18 Apr 2016 after consolidating and touched an intraday high of 2,111 before closing at 2,092.
Based on Chart 1 below, although S&P500 formed a new five month high on 20 Apr 2016, indicators such as MACD and RSI have exhibited bearish divergences. ADX slightly increased from 19.8 on 8 Apr 2016 to 20.8 on 22 Apr 2016, indicative of a lack of trend. In my opinion, although the medium term trend continues to be up, as evidenced by the rising exponential moving averages (“EMAs”), S&P500 may consolidate between 2,020 – 2,120. It is difficult to envisage S&P500 may breach the all-time high of 2,135 given the current chart outlook.
Near term supports: 2,081 / 2,067 / 2,059
Near term resistances are around 2,105 / 2,114 / 2,130 -2,135
Chart 1: S&P500 – unlikely to breach all-time high of 2,135
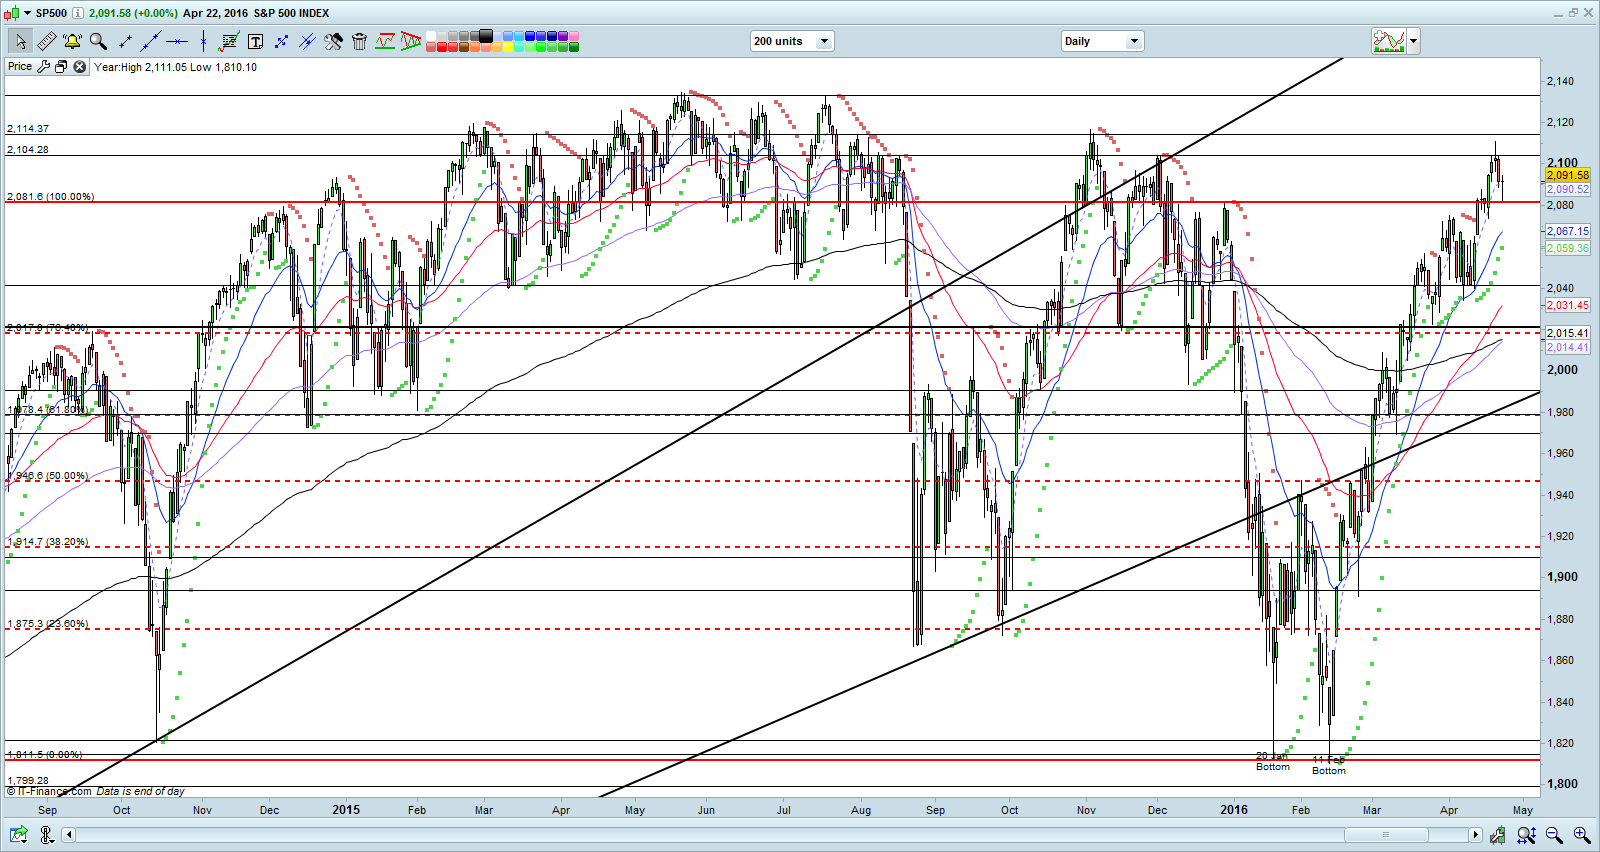
Source: CIMB chart as of 22 Apr 2016
Hang Seng Index
On 8 Apr 2016, I mentioned that “Hang Seng is likely to trade within a range of 19,500 – 20,950 in the next two weeks. A sustained break below 19,500 negates the slight bullish tinge in the chart.”
–> Hang Seng broke out of 20,950 on 13 Apr 2016 and closed at 21,467 on last Fri.
Based on Chart 2 below, Hang Seng’s chart looks pretty bullish from its rising EMAs, strengthening indicators such as RSI, MACD and ADX. For example, ADX has increased from 13.6 on 8 Apr 2016 to 19.6 on 22 Apr 2016. Although this is still indicative of a lack of trend, the increase is encouraging. A clearer signal is to observe whether Hang Seng can stage a sustained breach above its 200D EMA, which is currently at 21,649. (It is noteworthy that Hang Seng has not made a sustained breach above its 200D EMA since 6 Jul 2015.) A sustained break below 20,500 negates the bullish tinge in the chart.
Near term supports: 21,347 / 20,950 / 20,765
Near term resistances: 21,649 / 21,720 / 22,200
Chart 2: Hang Seng – to monitor whether it can make a sustained breach above its 200D EMA
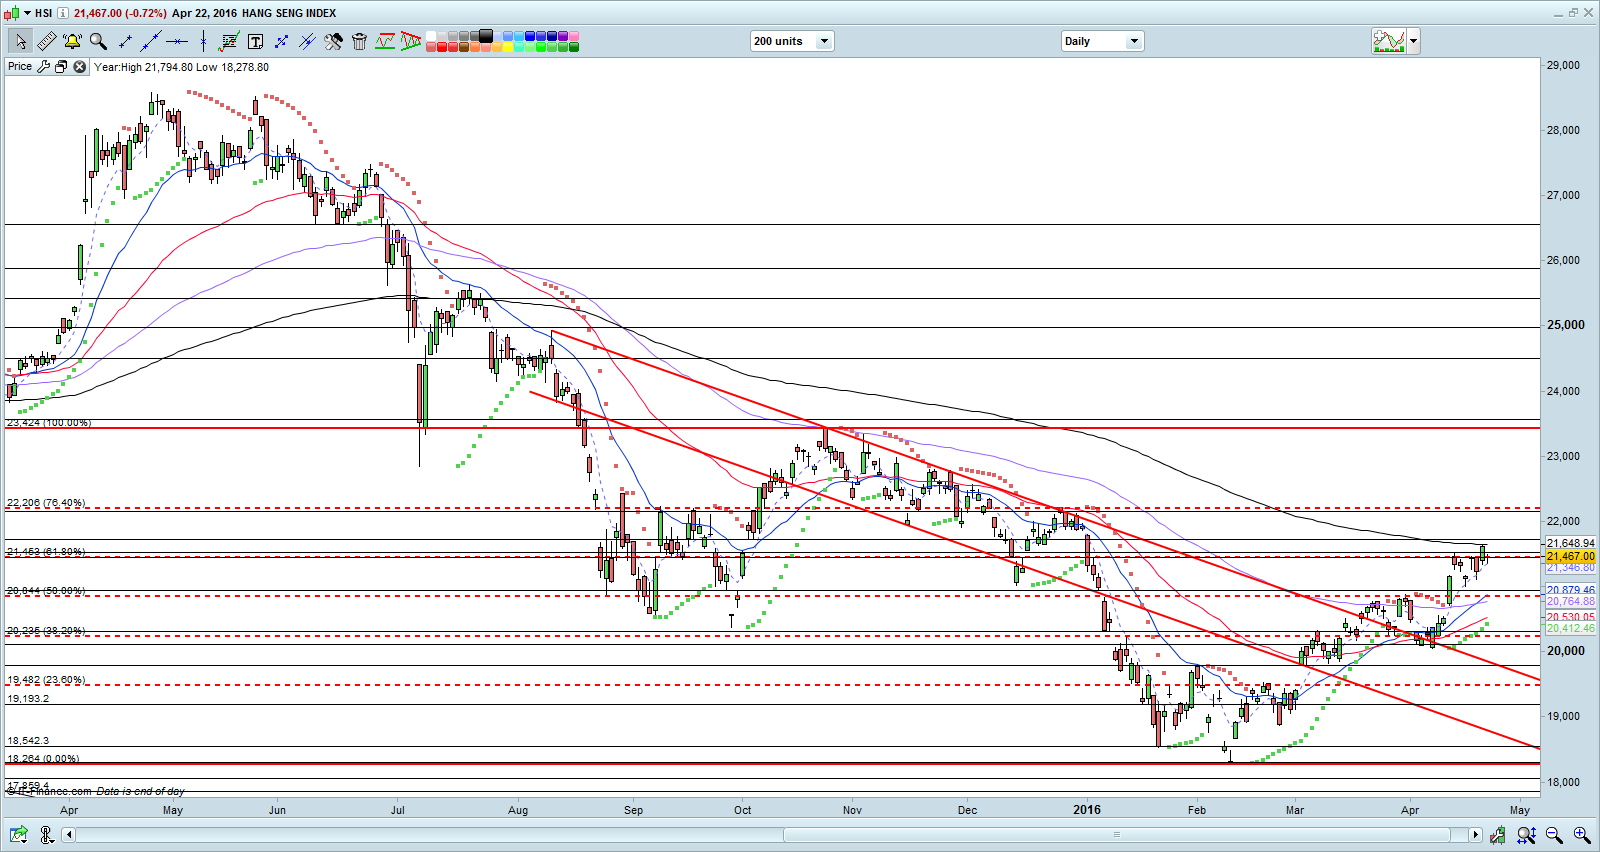
Source: CIMB chart as of 22 Apr 2016
STI Index
On 8 Apr 2016, I wrote that “STI continues to be in a consolidation phrase 2,700 – 2,909 with a downward bias. A break below 2,700 negates the bullish tinge in the chart.”
–> STI broke above 2,909 on 14 Apr 2016 and closed at 2,940 on last Fri.
Based on Chart 3 below, STI looks bullish as it has closed above its 200D EMA for seven consecutive trading days! This is significant as it has not closed above its 200D EMA for so many days since 2 Jun 2015. ADX has increased from 17.9 on 8 Apr 2016 to 22.7 on 22 Apr 2016, indicative of a trend. However, this does not necessarily mean the long term trend for STI has reversed. In my opinion, I prefer to be prudent and prefer to see the following in the next two weeks:
a) STI should trade above its 200D EMA for the next two weeks;
b) 200D EMA should be rising over time. It is almost flat for now;
c) Both RSI and MACD have exhibited bearish divergences which is a concern. It will be good if both RSI and MACD should form higher highs than their Mar 2016 high.
It is noteworthy that a break below 2,880 negates the bullish tinge in the chart.
Near term supports: 2,909 / 2,880 / 2,850
Near term resistances: 2,970 / 3,000 / 3,039
Chart 3: STI – to monitor whether it can continue to trade above its 200D EMA
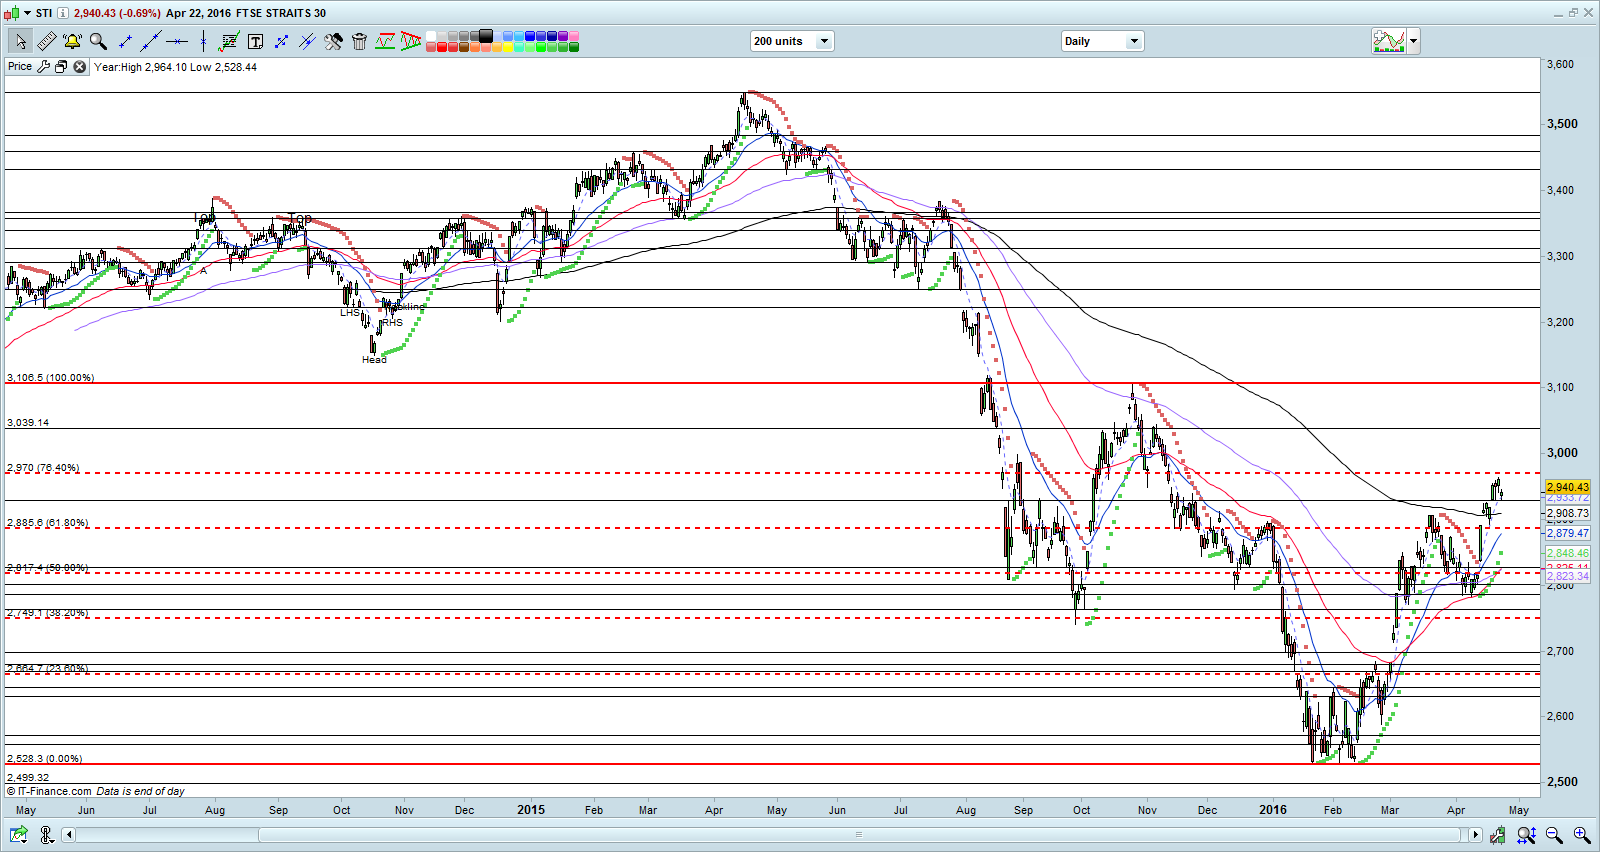
Source: CIMB chart as 22 Apr 2016
FTSE ST Small Cap Index (“FSTS”)
On 8 Apr 2016, I wrote that “FSTS seemed to have peaked at 405 on 18 Mar 2016. In the next two weeks, FSTS may consolidate with a downward bias. A break below / above 391 / 405 points to a measured technical target of 377 / 419 respectively.”
–> FSTS continued to trade within the range 391 – 405. It closed at 401 on 22 Apr 2016.
Based on Chart 4 below, FSTS continues to consolidate within the range 391 – 405. A break below / above 391 / 405 points to a measured technical target of 377 / 419 respectively.
Near term supports are at 399 / 397 / 391.
Near term resistances are at 405 / 409 / 415
Chart 4: FSTS – continues to consolidate
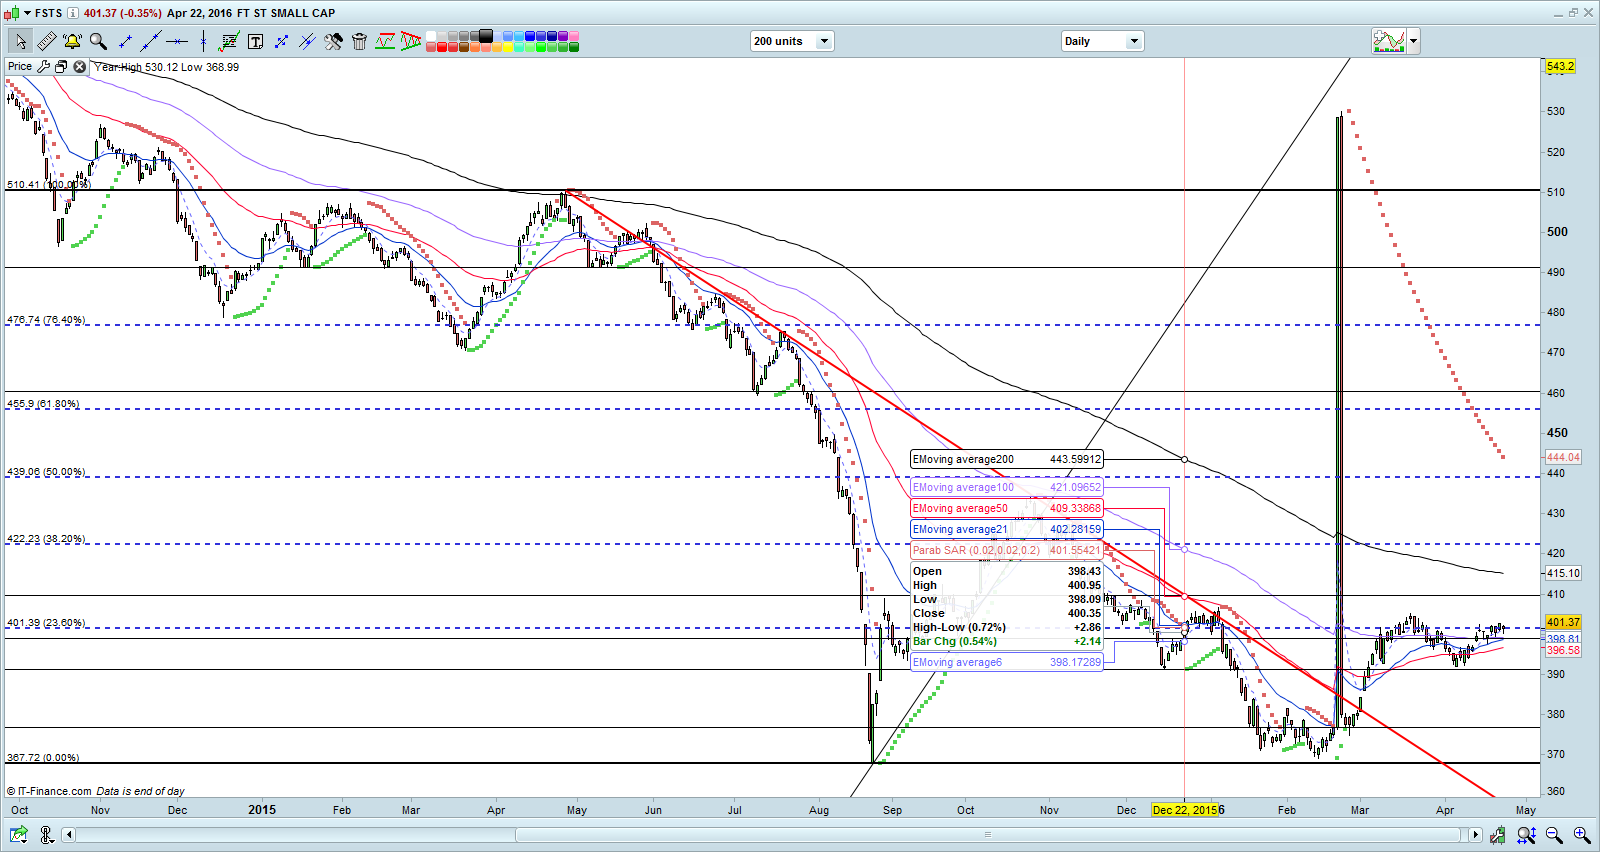
Source: CIMB chart as of 22 Apr 2016
Conclusion
These two weeks have been another exciting and busy period for me. I have raised my percentage invested back from 0% to 30% (this takes into account of short positions) by accumulating 4 – 5 stocks. I have already taken profit on 3 stocks and left 2 stocks. In addition, I am fortunate to take profit on all 3 short positions despite the market rally. My current % invested is around 15%.
In the next 1 – 4 weeks, I am likely to do more opportunistic trading in view of the results period. Although my comfort level on my percentage invested is around 30 – 50%, I may raise it temporarily in the next 1-4 weeks for short term opportunistic trades. (My clients will be duly informed on new stocks which I have entered and any significant portfolio change.) Besides my usual reasons which I have written in my previous market outlook write-ups, I like to add the following on why I am comfortable with only 30-50% invested:
a) More than 800 U.S. listed companies will report results next week. The recently released results are mostly disappointing from Alphabet, Microsoft, IBM, Intel, Caterpillar, Nike, Netflix etc. In fact, US$68b were wiped out from shares in Alphabet, Microsoft and Netflix after they posted worse than expected results;
b) According to Thomson Reuters, S&P500 is trading around 17.8x estimated earnings, the highest since 2004 and sharply above the average 15x over the past 30 years.
c) The British referendum on 23 June is getting nearer. Funds are unlikely to take on large positions ahead of such uncertainty, especially taking into account of S&P500’s rich valuation.
d) “Sell in May and go away” is a well-known market axiom. Most data point to some degree of outperformance if we sell in May and enter the market in Nov. According to an article on TheStreet.com, from 1950 through 2015, S&P500 posted an average monthly returns of 1.4% for Nov through Apr, as compared to 0.5% for May through Oct.
As mentioned previously, readers who wish to be notified of my write-ups and / or informative emails, they can consider to sign up at http://ernest15percent.com so as to be included in my mailing list. However, this reader’s mailing list has a one or two-day lag time as I will (naturally) send information (more information, more emails and more details) to my clients first. For readers who wish to enquire on being my client, they can consider to leave their contacts here http://ernest15percent.com/index.php/about-me/
Lastly, many new clients have asked me how I screen and decide which companies to take a closer look / write. To understand more about my basis of deciding which companies to write, you can download a copy of my eBook available on my website here.
P.S: Do note that as I am a full time remisier, I can change my equity allocation fast to capitalize on the markets’ movements.
Disclaimer
Please refer to the disclaimer here