Dear readers,
Two weeks ago, I mentioned that although I am cautious on the overall market in the next couple of months, I have spotted at least two companies which I may accumulate on weakness. I have since increased my percentage invested from around 36% to 80% by accumulating on one stock on weakness. About half of my portfolio (i.e. approximately 40%) is invested in one stock.
Notwithstanding some specific stocks, I remain cautious on the general market.
Read on to find out why.
S&P500 Index
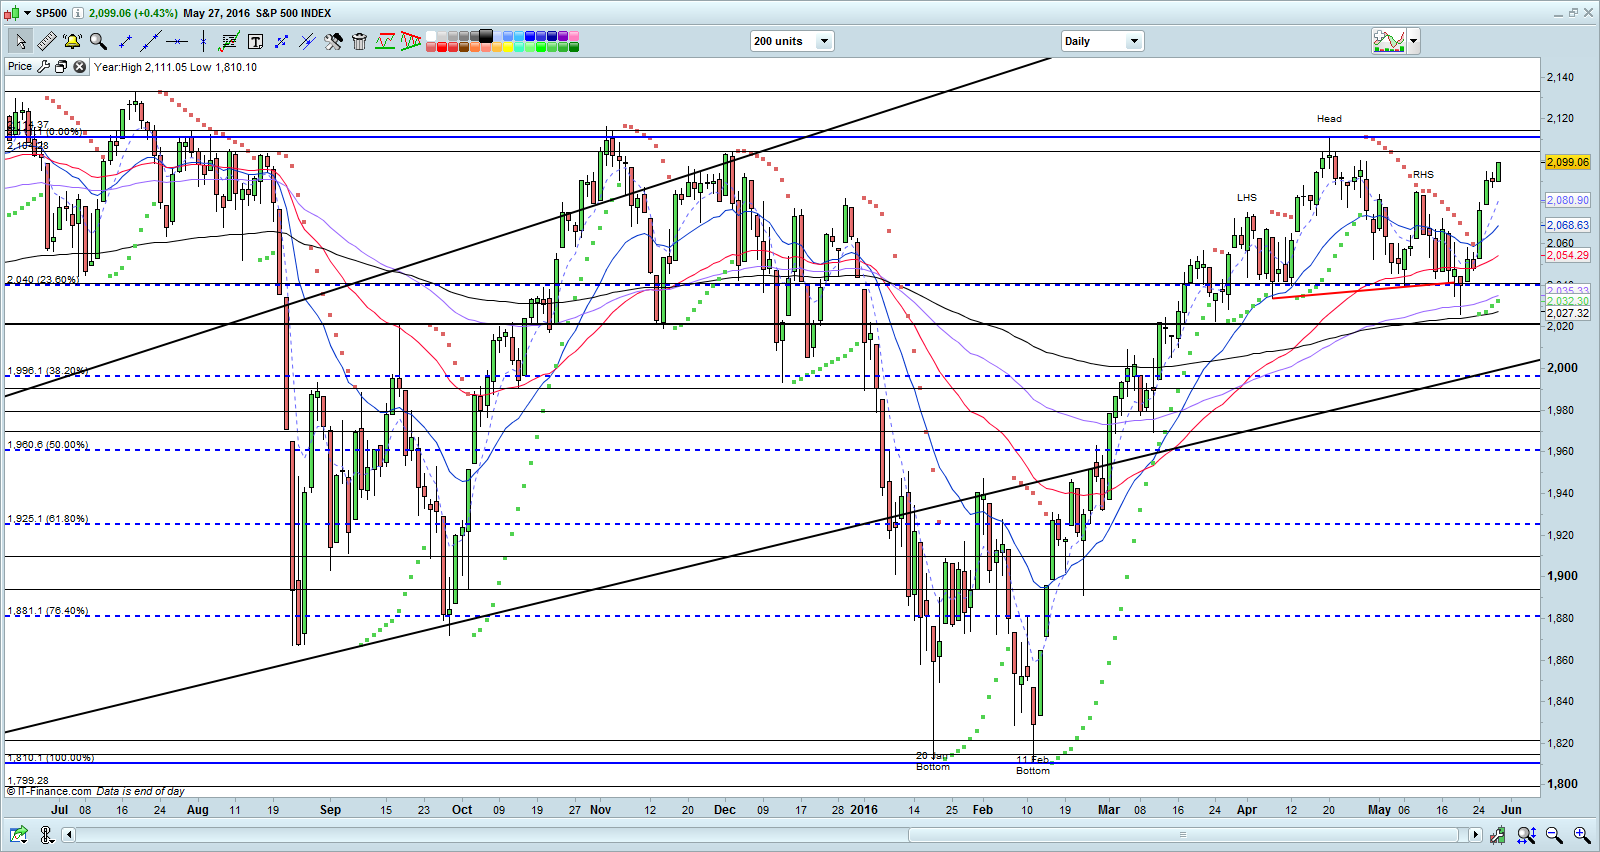
Just to recap what I have mentioned on 13 May 2016 (see here), I wrote “S&P500 seems to be forming a potential bearish head and shoulder formation with the neckline around 2,040. This formation needs confirmation with a break below the neckline with volume expansion.”
–> On 19 May 2016, S&P500 fell below 2,040 to touch an intraday low of 2,026 before closing at 2,040 on the same day. In other words, it did not confirm the potential bearish head and shoulder formation.
Based on Chart 1 below, after the failure to breach the neckline at 2,040 on a sustained basis, S&P500 staged a strong bounce and closed at 2,099 on last Fri. RSI has risen from 44.0 on 13 May 2016 to 61.4 on last Fri. Despite the rally seen from 19 May to 27 May, ADX has barely increased from 14.7 on 13 May 2016 to 15.8 on 27 May 2016, indicative of a lack of trend. Based on my personal interpretation, it seems unlikely that S&P500 can make a sustained breach 2,104 – 2,115 in the near term.
Near term supports: 2,079 – 2,081 / 2,069 / 2,054
Near term resistances: 2,104 / 2,111 – 2,115 / 2,133 – 2,135
Chart 1: S&P500 – unlikely to breach 2,104 – 2,115
Source: CIMB chart as of 27 May 2016
Hang Seng Index
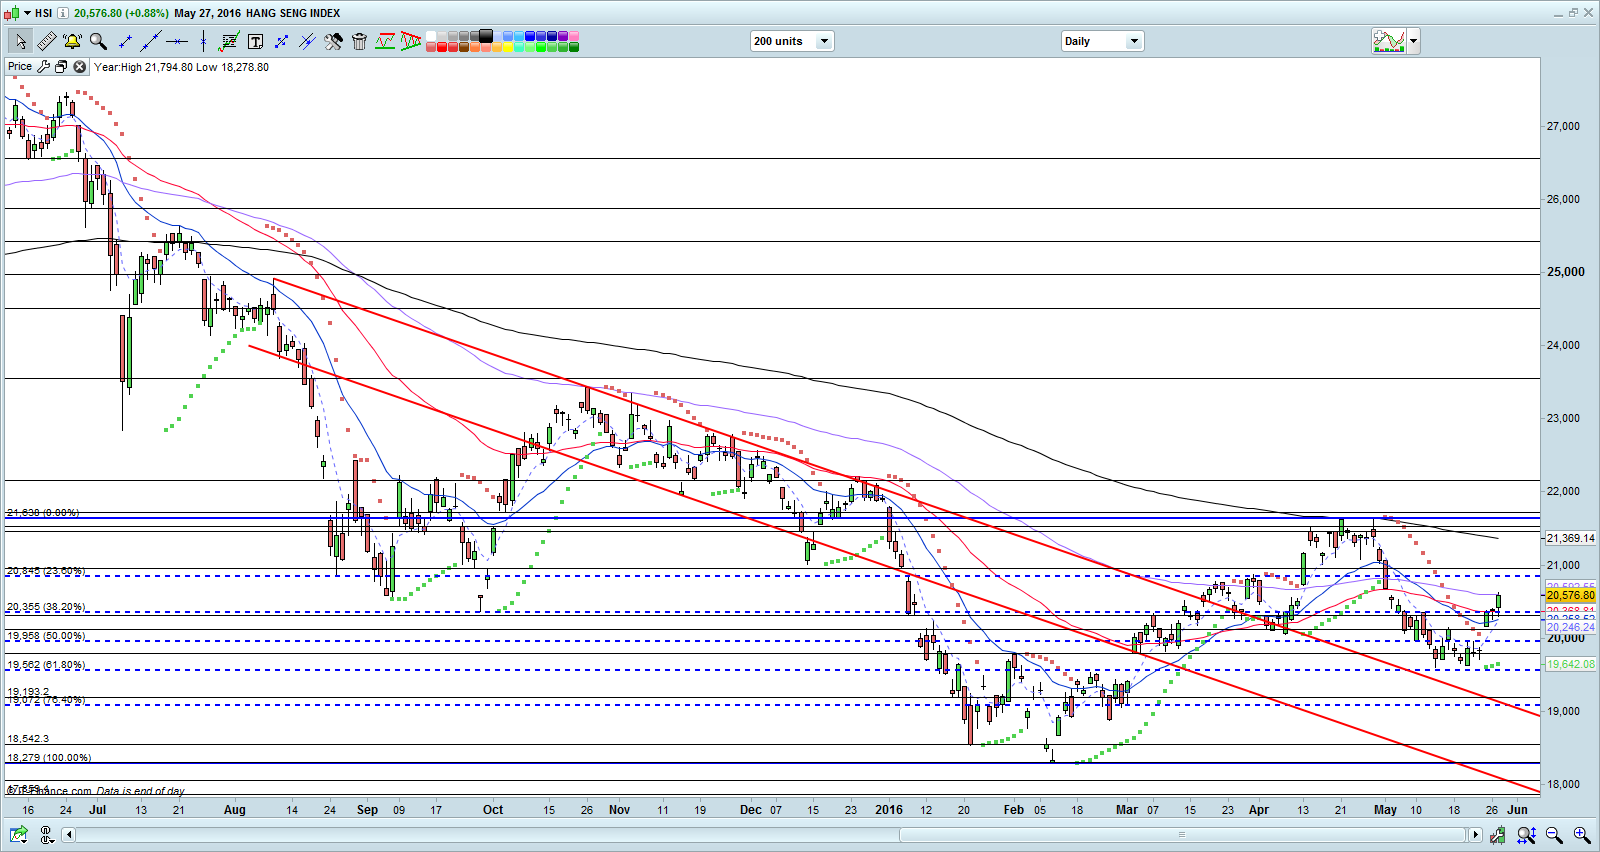
On 13 May 2016, I mentioned that “Hang Seng looks more bearish than last week. All its exponential moving averages (“EMA”) such as 21D, 50D, 100D and 200D have turned down. 21D EMA has formed death crosses with 50D and 100D EMA. Given the current chart outlook, Hang Seng is likely to close the breakaway gap (19,420 – 19,784) formed on 1-2 Mar 2016. As previously mentioned, a sustained break below 19,500 is bearish for the chart”
–> For the past two weeks, Hang Seng traded between 19,632 – 20,620. It partially closed the breakaway gap (19,420 – 19,784) formed on 1-2 Mar 2016 but did not make a sustained break below 19,500. Hang Seng closed at 20,577 on last Fri.
Based on Chart 2 below, although Hang Seng has rebounded from the low of 19,632 on 20 May 2016, 21D which formed death crosses with 50D and 100D EMA has not crossed above 50D and 100D EMA. Despite the rally seen for the past fortnight, ADX has declined from 22.1 on 13 May 2016 to 20.5 on 27 May 2016. RSI has surged from 31.7 on 13 May 2016 to 56.0 on 27 May 2016. Given the current chart outlook, Hang Seng still has a bearish tinge in the chart. A sustained break above its declining 200D EMA (currently at 21,369) will negate the bearish tinge. A sustained break below 19,500 and a complete covering of the gap (19,420 – 19,784) will be very negative for the chart.
Near term supports: 20,246 – 20,369 / 20,120 / 19,958
Near term resistances: 20,593 / 20,845 – 20,945 / 21,215
Chart 2: Hang Seng – still has a bearish tinge despite the rebound
Source: CIMB chart as of 27 May 2016
STI Index
On 13 May 2016, I wrote that “My personal opinion is that over the next few weeks, notwithstanding some small technical rebound, STI is likely to trend downwards. In the event of a rebound, STI is likely to find strong resistance at 2,788 – 2,823.
–> Over the past two weeks, STI touched an intraday low of 2,722 on 16 May 2016 and an intraday high of 2,806 on 27 May 2016. It closed at 2,803 on last Fri.
Based on Chart 3 below, despite the small technical rebound, 21D EMA which has formed death crosses with 50D and 100D EMA has not crossed above 50D and 100D EMA yet. ADX has declined from 26.1 on 13 May 2016 to 19.6 on 27 May 2016, indicative of a lack of trend.
Since 4 May 2016 through 26 May 2016, STI has traded between the range 2,713 – 2,791. STI seems to have staged a bullish break out from this range on 27 May 2016, by closing at 2,803. However, we need a few days to monitor whether the bullish break is on a sustained basis. My personal view is that STI still has a bearish tinge in the chart. It faces strong resistance around 2,791 – 2,825 over the next few weeks. In the unlikely event that it makes a sustained close above 2,825, a more formidable resistance is at its declining 200D EMA, currently at 2,882. A break below 2,680 on a sustained basis is very negative for the chart. A sustained break above 2,882 is bullish for the chart.
Near term supports: 2,796 / 2,782 / 2,775
Near term resistances: 2,807 / 2,825 / 2,860
Chart 3: STI – faces strong resistance 2,791 – 2,825 / 2,882

Source: CIMB chart as 27 May 2016
FTSE ST Small Cap Index (“FSTS”)
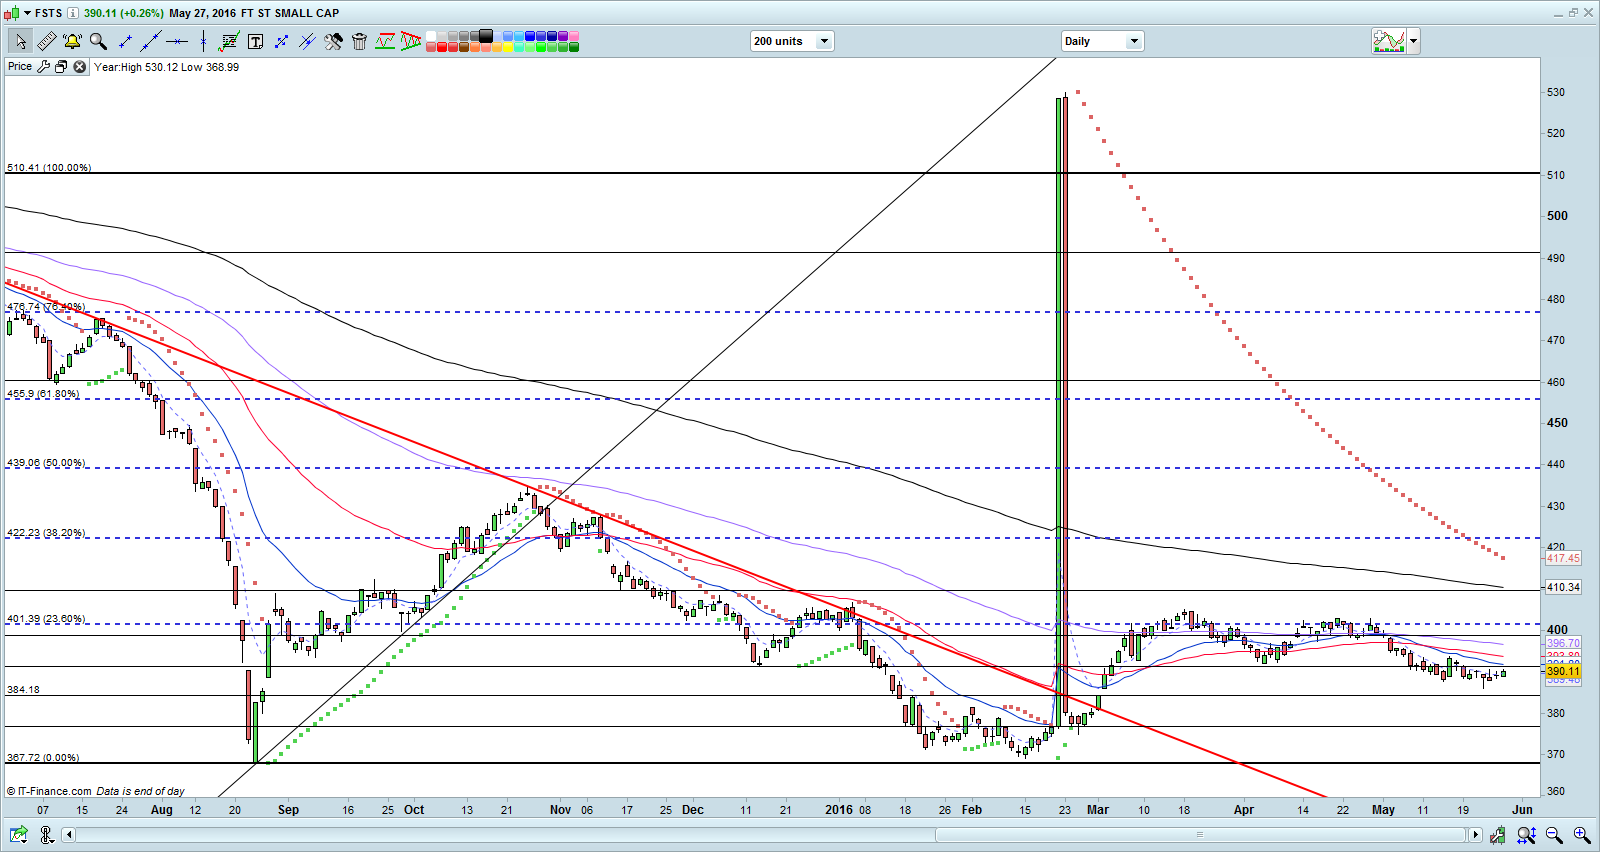
On 13 May 2016, I wrote that “FSTS broke below the 3 month plus trading range 391 – 405 which is a negative development. 21D, 50D, 100D and 200D EMAs have turned downwards. A sustained break below 391 points to a measured technical target of 377.”
–> FSTS marginally closed higher from 389 on 13 May 2016 to 390 on 27 May 2016 but it did not make a sustained close above 391.
Based on Chart 4 below, it looks negative since FSTS broke below 391 on 11 May 2016. 21D, 50D, 100D and 200D EMAs continue to trend lower. A sustained break below 391 points to a measured technical target of 377. FSTS seems weaker than STI on a chart basis.
Near term supports are at 386 / 384 / 377
Near term resistances are at 392 / 394 / 397 – 399
Chart 4: FSTS – seems weaker than STI
Source: CIMB chart as of 27 May 2016
Conclusion
Two weeks ago, I mentioned that although I am cautious on the overall market in the next couple of months, I have spotted at least two companies which I may accumulate on weakness. I have since increased my percentage invested from around 36% to 80% by accumulating on one stock on weakness. About half of my portfolio (i.e. approximately 40%) is invested in one stock. (Yep, I have a large risk appetite and I take concentrated positions, instead of diversified into many stocks. My clients will & are informed on new stocks which I have entered and any significant portfolio change.)
Notwithstanding some specific stocks, I remain cautious on the general market. Some of the factors which cause me to be wary are:
a) Upcoming FOMC meeting on 15 June 2016 (we shall know the outcome on 16 June, 2 am) and UK referendum on 23 June;
b) Limited catalysts for funds to hold significant equity positions especially when most companies have already reported their results and / OR have gone ex-dividend and in view of point (a) above;
c) U.S. S&P500 valuations are pretty pricey. Barring any significant improvement in corporate results in the next couple of quarters, according to Ned Davis Research, S&P500 companies are trading at 2.2x median price to sales ratio. This is higher than that of 2000 and 2007 where markets peak. In addition, according to Meb Faber, co-founder and chief investment officer at Cambria Investment Management, S&P500 companies are trading at 26.2x Shiller PE, the highest since 2007;
d) S&P500 faces strong resistance, as well as the other indices on the technical front;
e) China continues to be a concern. Although the Shanghai Composite Index seems to have stabilized with lower daily volatility, it remains to be seen whether China’s economic data may continue to worsen over the next couple of months.
Readers who wish to be notified of my write-ups and / or informative emails, they can consider to sign up at http://ernest15percent.com so as to be included in my mailing list. However, this reader’s mailing list has a one or two-day lag time as I will (naturally) send information (more information, more emails with more details) to my clients first. For readers who wish to enquire on being my client, they can consider to leave their contacts here http://ernest15percent.com/index.php/about-me/
Lastly, many new clients have asked me how I screen and decide which companies to take a closer look / write. To understand more about my basis of deciding which companies to write, you can download a copy of my eBook available on my website here.
P.S: Do note that as I am a full time remisier, I can change my equity allocation fast to capitalize on the markets’ movements.
Disclaimer
Please refer to the disclaimer here