On 17 May 2016, I wrote that Innovalues’ profit taking may be over soon (see here) and a break above $0.925 – 0.935 on a sustained basis should negate the bearish tinge in its chart. It was coincidental that Innovalues surged 6.5% or $0.060 to close $0.985 on the following day (18 May 2016) on strong volumes and has not traded below $0.925 since then.
What’s next for Innovalues? Read on for more.
Chart analysis
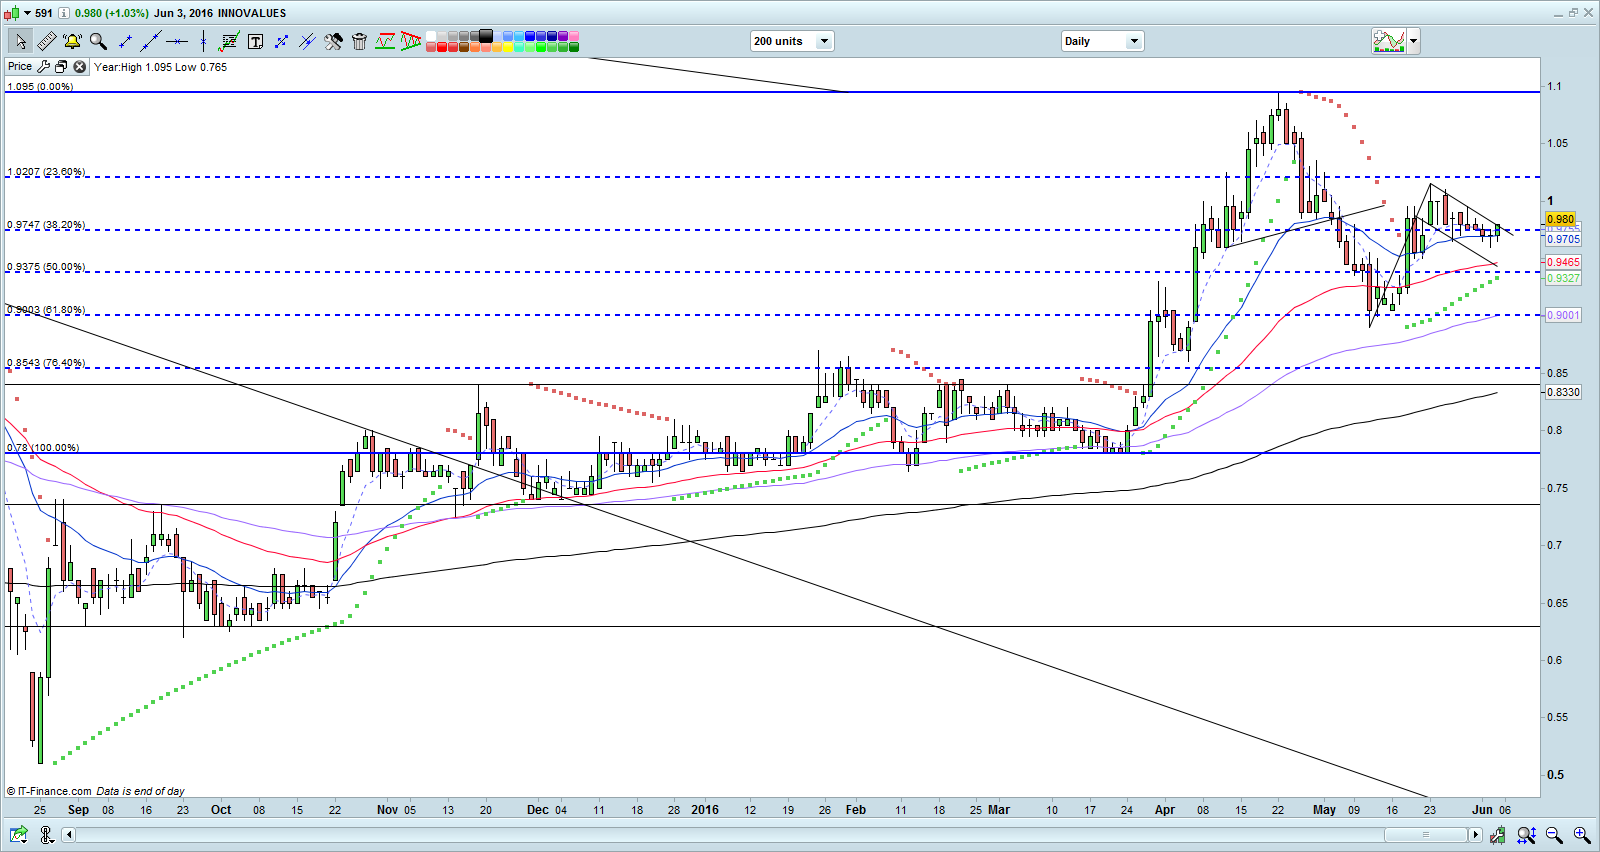
After hitting an intraday high of $1.015 on 23 May 2016, Innovalues has been consolidating its gain. Based on Chart 1 below, it seems to be forming a potential bullish flag formation. If Innovalues can breach $0.980 with volume expansion and on a sustained basis, an eventual measured technical target price is around $1.080. It is noteworthy that Innovalues has successfully tested its 21D exponential moving average (“EMA”, currently at $0.970) six times since 19 May 2016. All the EMAs are rising with a consistent degree of separation between the different EMAs which is indicative of a well-established uptrend. Furthermore, the price consolidation after hitting an intraday high of $1.015 on 23 May 2016 was accompanied with relatively low volume. The trading volume for only two days (out of the 12 trading days i.e. 19 May – 3 Jun 2013), were accompanied with volumes greater than 100D volume which was around 1.87m shares. (Ave 30D volume amounted to around 2.6m shares). Innovalues closed at $0.980 on 3 Jun 2016.
Notwithstanding the above possibly bullish chart setup, a break below $0.930 with volume expansion and on a sustained basis negate the bullish tinge in the chart.
Near term supports: $0.970 / 0.945 / 0.930
Near term resistances: $0.980 / 1.010 – 1.020 / 1.080
Chart 1: Innovalues’ potential bullish flag formation
Source: CIMB chart as of 3 Jun 16
Conclusion – Innovalues’ chart worth to take note
In view of the above noteworthy factors and based on Chart 1 above, my personal opinion is that Innovalues seems to be forming a potential bullish flag formation. Readers should consult the various analyst reports, Innovalues company website (click here) and my previous write-up dated 17 May 2016 (see here) for more information.
Disclaimer
Please refer to the disclaimer here
Im thankful for the blog article.Really thank you! Great.