Dear readers,
Are you burnt in the aftermath of THE BREXIT?
What should you do now? To cut loss, hold or buy more? Before you make the decision, it is good to consider the various markets and how they are likely to fare in the next two weeks.
S&P500 Index
Just to recap what I have mentioned on 10 Jun 2016 (see HERE), I wrote “Given the low ADX, S&P500 may trade between 2,034 – 2,106 (barring Brexit on 23 Jun 2016).”
–> Although Brexit happens, S&P500 reached an intraday low of 2,033 on last Fri, just 1 point above my mentioned 2,034. S&P500 closed at 2,037.
Based on Chart 1 below, with the sharp drop seen on last Fri, S&P500 closed below the important support area of 2,038 – 2,040. This area is a combination of its 200D exponential moving average “EMA” and historical support. The close below 2,038 – 2,040 is negative for the chart but I have to monitor over the next few trading sessions to assess whether it has made a sustained close below its 200D EMA and whether it makes a sustained break below 2,034. It is noteworthy that S&P500 has traded within an approximate range of 2,034 – 2,111 since 28 Mar 2016. A sustained break below 2,034 points to an eventual technical target 1,957. Since 10 Jun 2016, ADX has declined from 20.2 to close 16.8, indicative of a lack of trend. Thus, the odds of it breaking below on 2,034 on a sustained basis may be slightly lesser. However, I prefer to wait on the sideline for the S&P500 and monitor over the next few trading sessions. It is noteworthy that volatility is high, thus time is required to monitor the S&P500 chart over the next few trading sessions.
Near term supports: 2,015 – 2,025 / 1,996 / 1,990
Near term resistances: 2,038 – 2,040 / 2,050 – 2,053 / 2,073
Chart 1: S&P500 – bearish if it makes a sustained break below 2,034
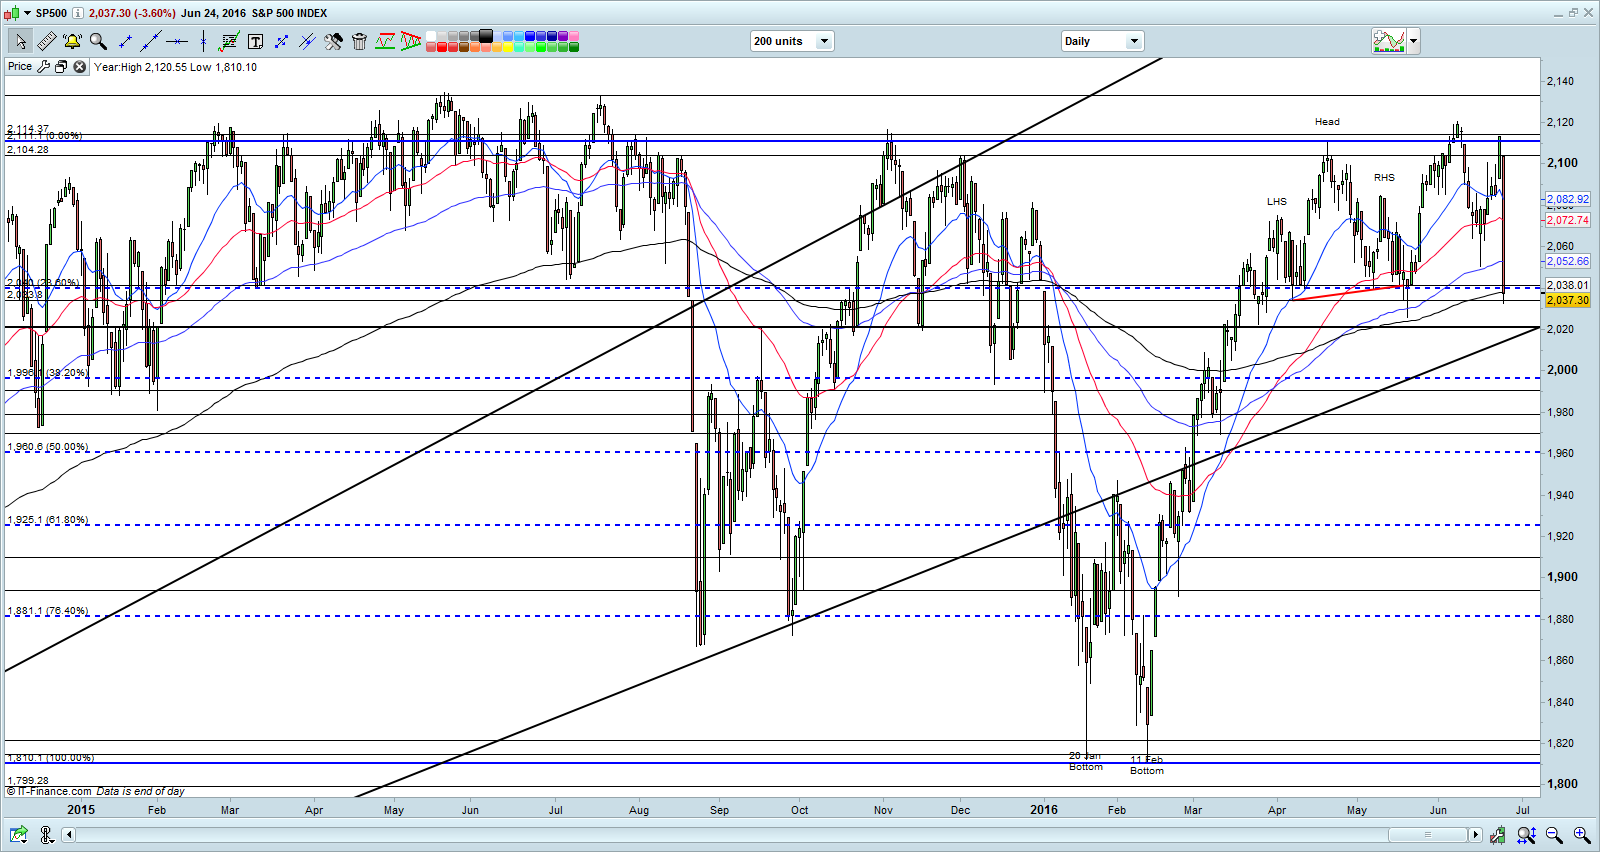
Source: CIMB chart as of 24 Jun 2016
Hang Seng Index
On 10 Jun 2016, I mentioned that “It would be a strong positive if Hang Seng can make a sustained breach above its 200D EMA (currently around 21,335). Conversely, it is negative if Hang Seng makes a sustained break below the support area 20,435 – 20,693”
–> Hang Seng broke below the support area 20,435 – 20,693 on 14 Jun 2016 and subsequently touched an intraday low 19,663 before closing at 20,259 on last Fri. Hang Seng fell 784 points, or 3.7% for the past two weeks.
Based on Chart 2 below, Hang Seng seems to have experienced some indecisive trading as seen by the long upper and lower shadows of the candle formed last Fri. ADX has declined from 25.3 on 10 Jun 2016 to 18.6 on 24 Jun 2016, indicative of a lack of trend. As of now, Hang Seng is likely to trade within the range 19,562 – 21,034 in the next two weeks. It is noteworthy that a sustained break below 19,420 – 19,595 is negative for the chart.
Near term supports: 19,958 / 19,562 / 19,420
Near term resistances: 20,355 / 20,530 – 20,623 / 20,845
Chart 2: Hang Seng – sustained break below 19,420 – 19,595 is negative
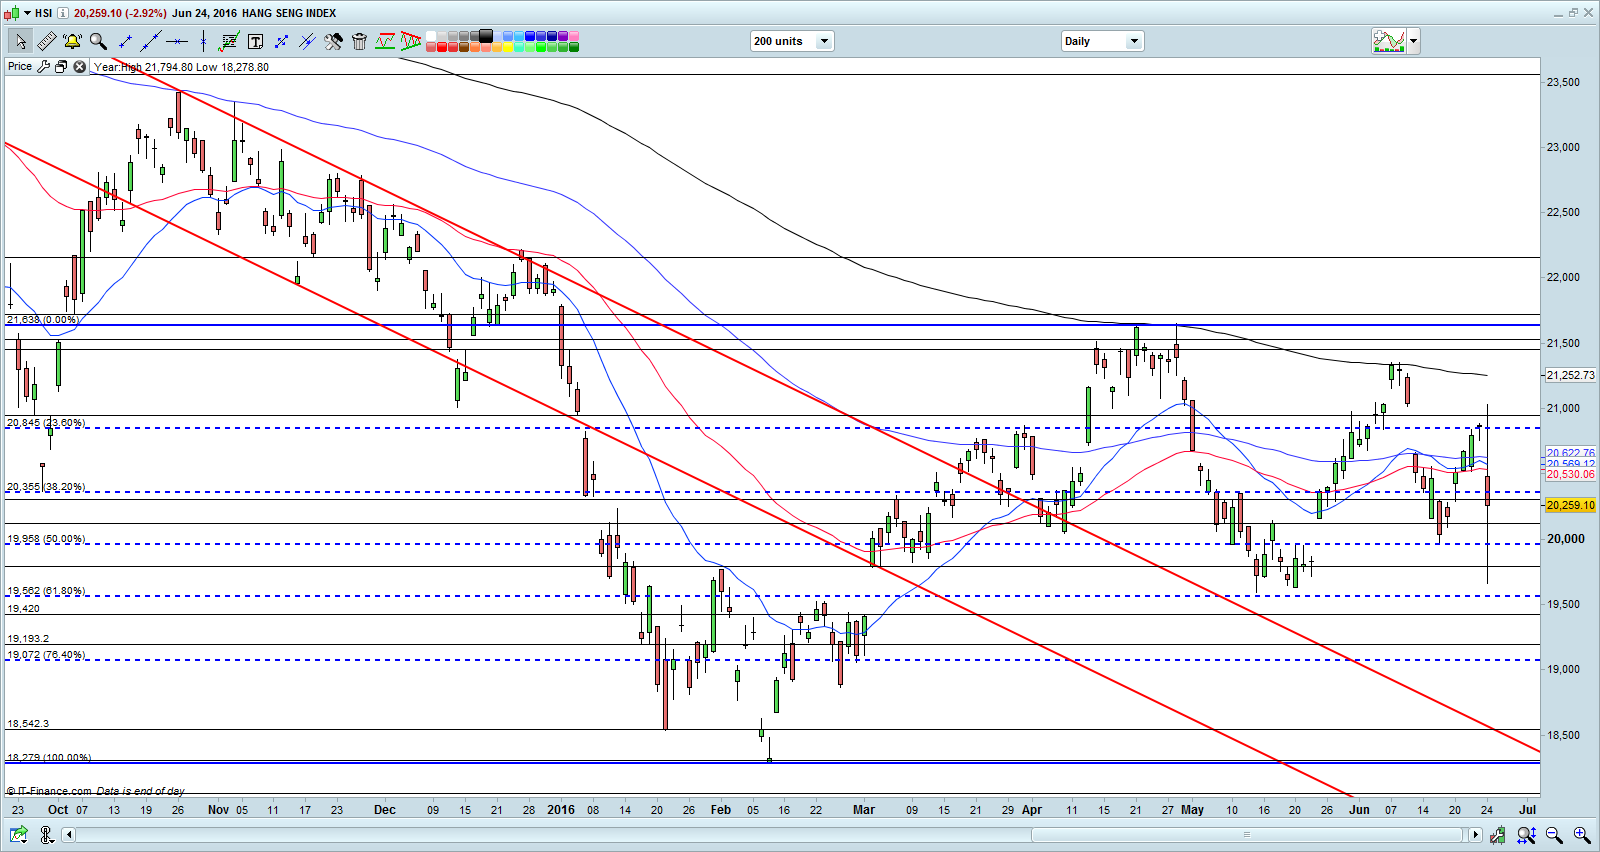
Source: CIMB chart as of 24 Jun 2016
STI Index
On 10 Jun 2016, I wrote that “STI seems likely to trade within a range of 2,713 – 2,882 in the next two weeks. A break below the support area of 2,791 – 2,809 on a sustained basis is negative for the chart.
On 16 Jun 2016, I pointed out in my write-up titled “STI dives 130 pts in 1 week! Time to buy in?” that STI’s near term supports are at 2,680 – 2,713 / 2,633 / 2,588 – 2,600. [click HERE to find out more]
–> STI broke below the support area 2,791 – 2,809 with a gap on 13 Jun 2016. It subsequently closed 88 points lower from 2,823 on 10 Jun 2016 to 2,735 on 24 Jun 2016. In fact, it touched an intraday low of 2,716, 3 points above the critical support region of 2,680 – 2,713 which I highlighted.
Based on Chart 3 below, although Friday’s drop was ugly, it was comforting to see that STI did not break the recent low of 2,713 on 13 May 2016. ADX has declined from 22.1 on 10 Jun 2016 to close 15.6 on 24 Jun 2016, indicative of a lack of trend. Indicators such as RSI and MACD were mixed with RSI being neutral but MACD in the slightly oversold region. In the next two weeks, STI’s downside should be capped around the support regions of 2,588 – 2,600 / 2,633.
Near term supports: 2,713 / 2,680 / 2,655
Near term resistances: 2,746 – 2,750 / 2,787 / 2,803
Chart 3: STI – downside should be capped around 2,588 – 2,600 / 2,633

Source: CIMB chart as 24 Jun 2016
FTSE ST Small Cap Index (“FSTS”)
On 10 Jun 2016, I wrote that “In the next two weeks, FSTS likely trades between 388 – 401. A sustained break below 391 points to a measured technical target of 377. FSTS seems weaker than STI on a chart basis.”
–> FSTS broke below 391 on 13 Jun 2016 and went lower to reach my measured technical target of around 377 by touching an intraday low of 376 on 24 Jun 2016. FSTS indeed was weaker than STI. FSTS fell approximately 4.1% vis-à-vis 3.1% drop for STI over the past two weeks to close 379 on last Fri.
Based on Chart 4 below, ADX has climbed from 16.1 on 10 Jun 2016 to close 24.3 on 24 Jun 2016, indicative of a trend. All the EMAs are pointing downwards with a widening degree of separation. All in, FSTS looks bearish and weaker than STI. The bearish tinge is negated if FSTS can climb above 391 on a sustained basis.
Near term supports are at 377 / 371 / 368 – 369
Near term resistances are at 384 / 386 / 388
Chart 4: FSTS – looks bearish
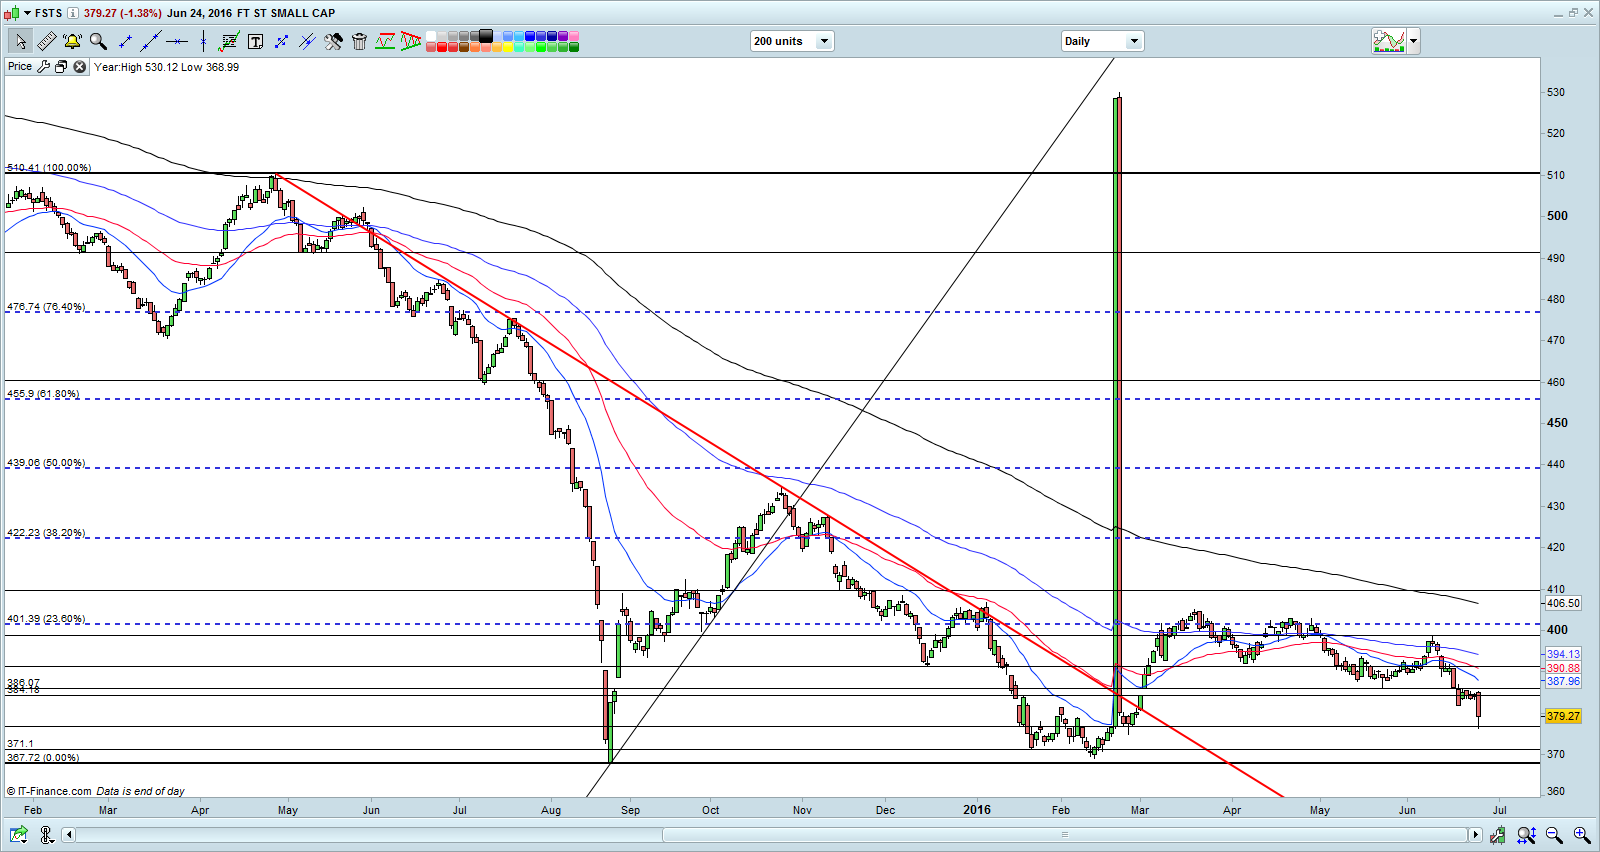
Source: CIMB chart as of 24 Jun 2016
Conclusion
Some people told me that they predicted right from the start that Brexit will occur and hence they stay out of the market. Others have told me that they have assessed the risk reward ratio and they have exited most stocks. I am happy for them.
However, for myself, I have raised my equity allocation from 31% on 10 Jun 2016 to 71% as of 24 Jun 2016 with the bulk of the purchases done on 16 – 20 Jun 2016 and 24 Jun 2016 as there were some attractive opportunities. To be frank, before the UK referendum on 23 Jun, my percentage invested is already around 60+%. [Recall that in my market outlook write-up on 10 Jun (click HERE), I wrote that I am unlikely to exceed 50% invested in the next wo weeks, unless I spot some extremely attractive opportunities.]
This percentage invested is in line with the probability and my view of the outcome of the UK referendum where the odds of a Brexit are lower than Bremain. Naturally, with the clairvoyance of hindsight, it would have been better to be 100% short, instead of 60+% long.
Nevertheless, even if given another chance, I will still be 60+% invested going into the UK referendum. This is because
a) The stocks which I bought are likely to have potential near term events which should cap any excessive downside risk;
b) I can increase my percentage invested to 150 – 200% with the help of leverage. In other words, I can easily more than double my equity allocation on sharp market selloffs, if necessary. Thus, my 60+% invested is different from others who do not leverage;
Personally, on 24 Jun, I have informed clients who are almost 100% invested in cash to consider accumulating some stocks on dips. This is because
a) According to DBS Research, STI is trading at around 11.2x forward PE which is marginally higher than the 10.8x seen during the height of the Eurozone debt crisis. Based on current developments, I doubt this Brexit will be worse than the European debt crisis;
b) STI’s near term strong supports are at 2,680 – 2,713 / 2,633 / 2,588 – 2,600. Given the current chart’s development, I think it is unlikely to go below 2,588 – 2,600 on a sustained basis. In the worst case, STI is unlikely to go below 2,530 on a sustained basis, even if there is a Brexit. Base case scenario with a Brexit is probably around 2,588 – 2,600. Hence base case potential downside is probably only around -5.4% (STI 2,735 vs base case 2,588 in the event of a Brexit);
At this time, I am looking into a couple of stocks and may accumulate them on dips in the next two weeks. Overall, I am excited and look forward to the next couple of weeks. (My clients have, will & are informed on new stocks which I have entered and any significant portfolio change.)
I have attached a personal compilation of stocks using Bloomberg data dated 24 Jun 2016, sorted by total potential return. I have used the following simple criteria:
a) SGD adjusted market cap >= S$200m;
b) Potential capital upside >= 5%;
c) Estimated div yield >= 2%
Table 1: Top five companies sorted by total potential return
![]()
Source: Blmberg as of 24 Jun 2016
Table 1 shows the top five companies sorted by total potential return. It is noteworthy that the potential capital upside and estimated dividend yield are obtained from Bloomberg. I do not know, and am not able to verify the accuracy of the numbers. Furthermore, the potential upside is subject to change as it is compiled from the analysts’ estimates.
Readers who wish to receive the full compilation of the companies and / or be notified of my write-ups and / or informative emails, can consider signing up at http://ernest15percent.com. However, this reader’s mailing list has a one or two-day lag time as I will (naturally) send information (more information, more emails with more details) to my clients first. For readers who wish to enquire on being my client, they can consider to leave their contacts here http://ernest15percent.com/index.php/about-me/
Lastly, many new clients have asked me how I screen and decide which companies to take a closer look / write. To understand more about my basis of deciding which companies to write, you can download a copy of my eBook available on my website HERE.
P.S: Do note that as I am a full time remisier, I can change my equity allocation fast to capitalize on the markets’ movements.
Disclaimer
Please refer to the disclaimer HERE