Dear readers,
Markets have continued to rally with the U.S indices clocking in a fourth consecutive weekly gain. Will the markets continue to defy gravity to reach new highs?
Read on for more.
S&P500 Index
Just to recap what I have mentioned on 8 Jul 2016 (see HERE), I wrote “Given the low ADX, bearish divergences between price and OBV, MACD and RSI, it is unlikely that S&P500 may stage a sustainable rally above an intraday all time high of 2,135 on 20 May 2015.”
–> On the contrary, S&P500 breached 2,135 and stayed above the level for the past two weeks. It closed at my previously mentioned resistance 2,175 on 22 Jul 2016.
Based on Chart 1 below, with the sharp rally over the past four weeks, it is good to see that all its exponential moving averages are moving higher with a good degree of separation. However, I am worried by two main factors namely, A) Although ADX has increased from 14.3 on 8 Jul 2016 to 18.1 on 22 Jul 2016, it is still below 20, indicative of a lack of trend. B) Indicators such as MACD, MFI and RSI exhibit bearish divergences. The break above the trading range of 2,034 – 2,111 points to an eventual measured technical target 2,188. Strong resistance is likely to be around 2,188 – 2,200.
Near term supports: 2,166 / 2,134 – 2,135 / 2,115
Near term resistances: 2,175 / 2,188 / 2,200
Chart 1: S&P500 – strong resistance around 2,188 – 2,200
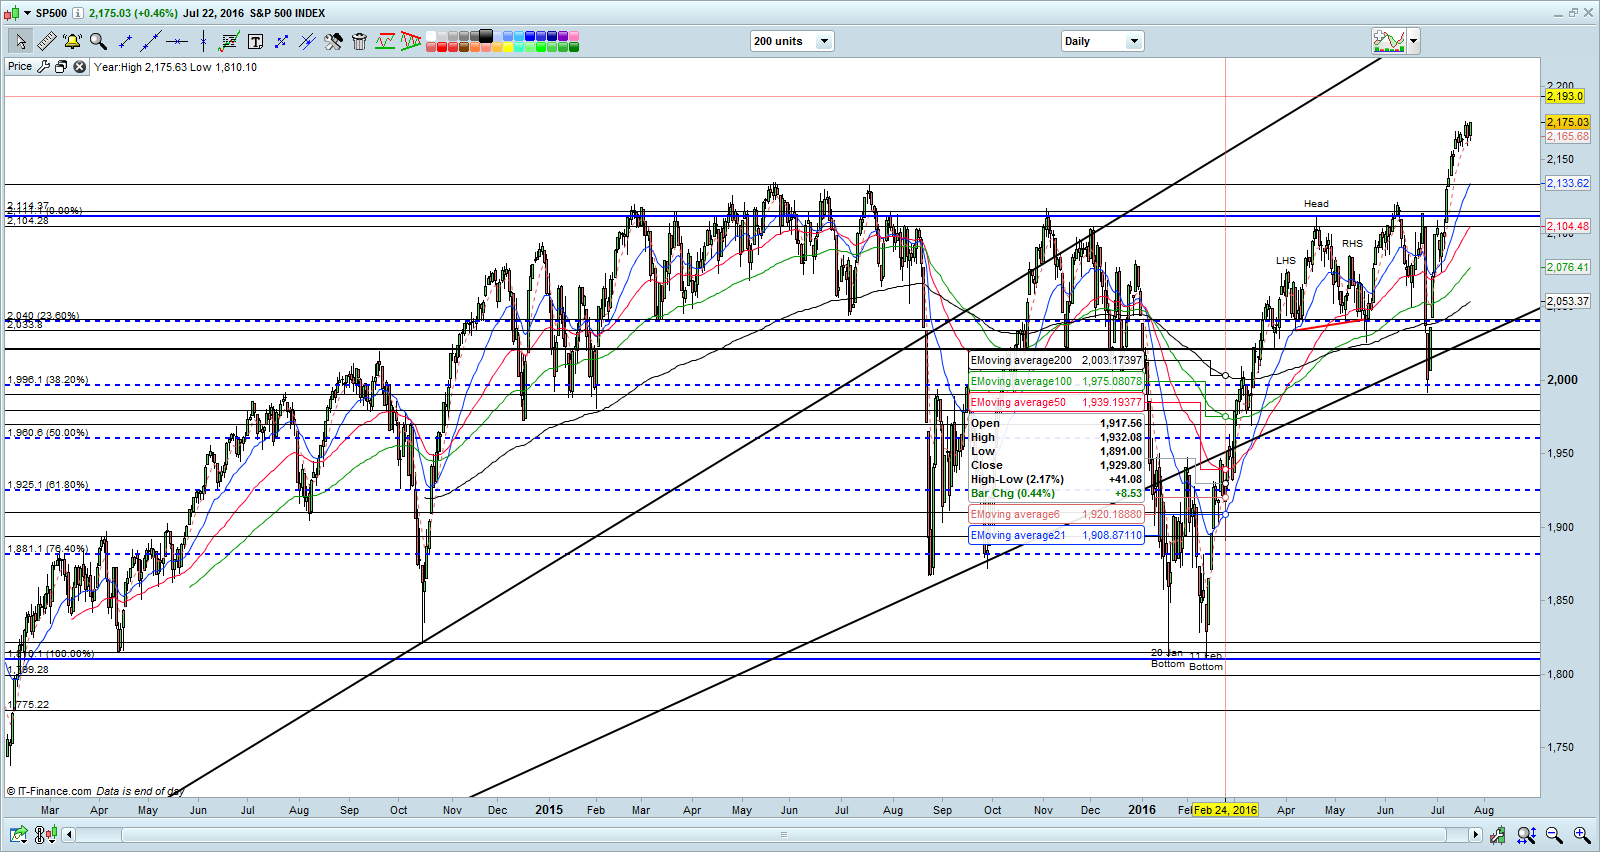
Source: CIMB chart as of 22 Jul 2016
Hang Seng Index
On 8 Jul 2016, I mentioned that “Given the weak ADX, Hang Seng is likely to trade within the range 19,958 – 21,195 in the next two weeks. It is noteworthy that a sustained break below 19,420 – 19,595 is bearish. Conversely, a sustained break above 21,195 is bullish.”
–> Yes and no. Hang Seng did not trade within the range but broke above 21,195 on 12 Jul 2016. However, it is true that a sustained break above 21,195 is positive, as Hang Seng continued to rally another 923 points to touch an intraday high of 22,118 on 21 Jul 2016 before closing at 21,964 on 22 Jul 2016.
Based on Chart 2 below, it is noteworthy that Hang Seng manages to close above its 200D EMA for the past eight trading sessions. Since 6 Jul 2015, Hang Seng has not managed to close above its 200D EMA for eight trading sessions. All its EMAs are moving higher with 21D EMA forming golden crosses with the latest golden cross formed with 200D EMA. ADX started to climb from 15.3 on 8 Jul 2016 to 20.2 on 22 Jul 2016. Although ADX is barely around 20, the increase in ADX is noteworthy. The slight drawback is that RSI exhibits mild bearish divergence. All in, Hang Seng chart looks positive over the medium term. A sustained break below the important supports 21,195 – 21,230 is negative.
Near term supports: 21,793 / 21,638 / 21,195 – 21,230
Near term resistances: 22,190 – 22,210 / 22,750 / 23,410
Chart 2: Hang Seng – chart looks medium term positive after the break 21,195
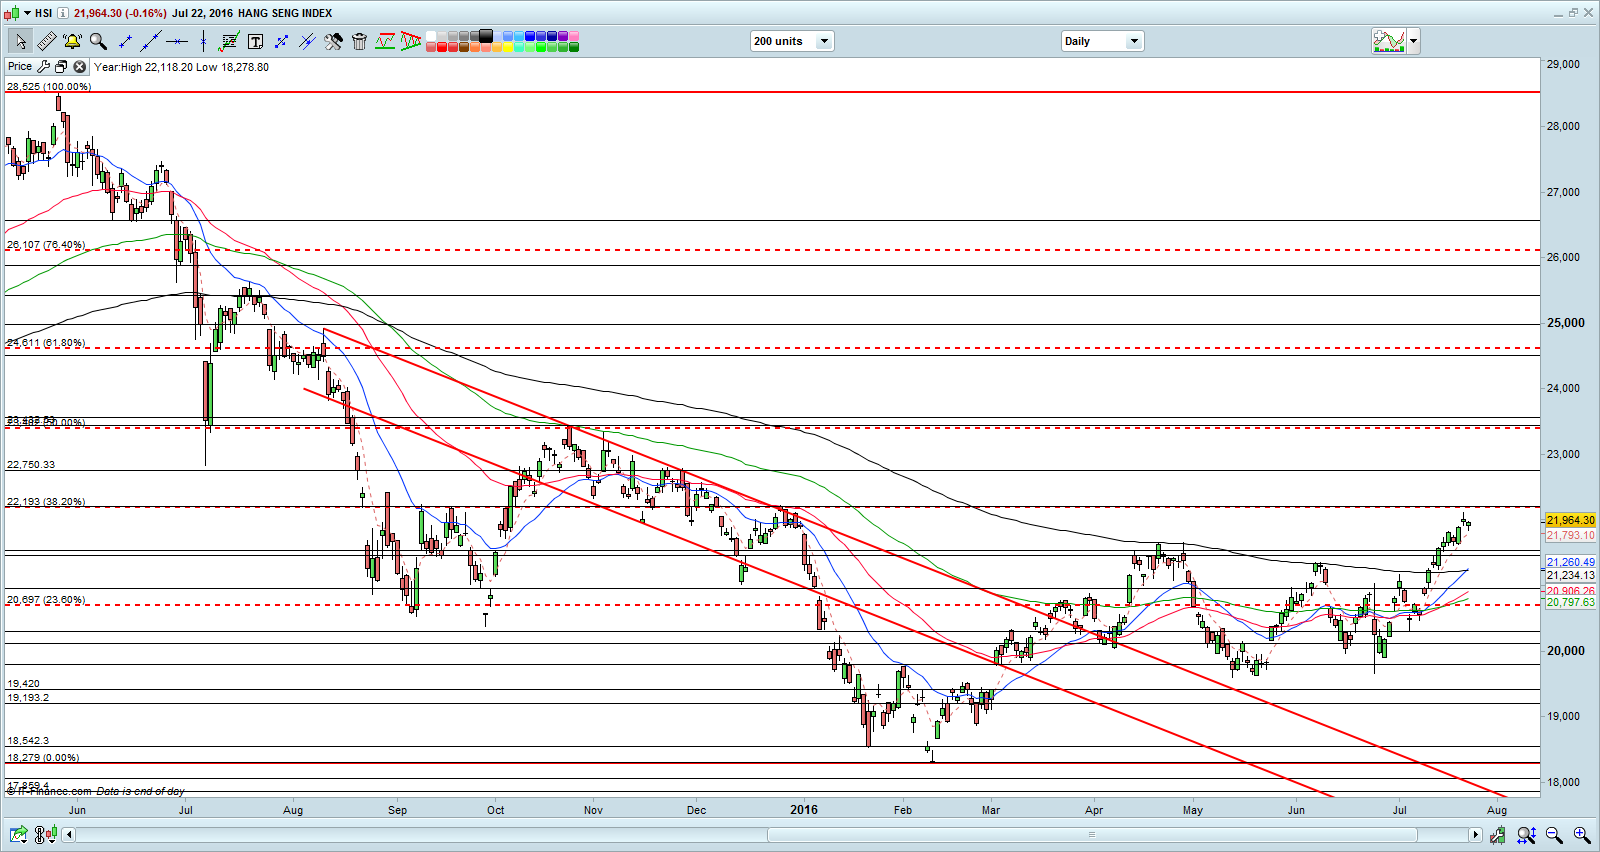
Source: CIMB chart as of 22 Jul 2016
STI Index
On 8 Jul 2016, I wrote that “STI looks a tad positive. ADX has climbed from 15.6 on 24 Jun 2016 to 19.1 on 8 Jul 2016. Although this is still below 20, the increase is noteworthy. 100D, 50D and 21D exponential moving averages (“EMA”) are rising with 21D EMA forming golden crosses with 50D and 100D EMA. A sustained breach above its 200D EMA (currently at 2,863) is very positive. It is noteworthy that STI has not traded above its 200D EMA since 2 Jun 2015”.
–> STI managed to close above its 200D EMA daily for the past two weeks. It closed at 2,945 on 22 Jul 2016.
Based on Chart 3 below, as mentioned previously, the sustained close above its 200D EMA for the past two straight weeks is very positive. It is noteworthy that STI has not traded above its 200D EMA since 2 Jun 2015. ADX has climbed from 19.1 on 8 Jul 2016 to 26.8 on 22 Jul 2016, indicative of a trend. All the EMAs are rising with 21D EMA forming golden crosses with 50D, 100D and 200D EMA. RSI closed at 68.9 on last Fri. The drawback to this positive chart development is the bearish divergences seen in RSI and MACD. Nevertheless, the overall trend is up.
Near term supports: 2,900 / 2,882 / 2,868
Near term resistances: 2,960 / 3,000 / 3,039
Chart 3: STI looks positive after sustained close above its 200D EMA
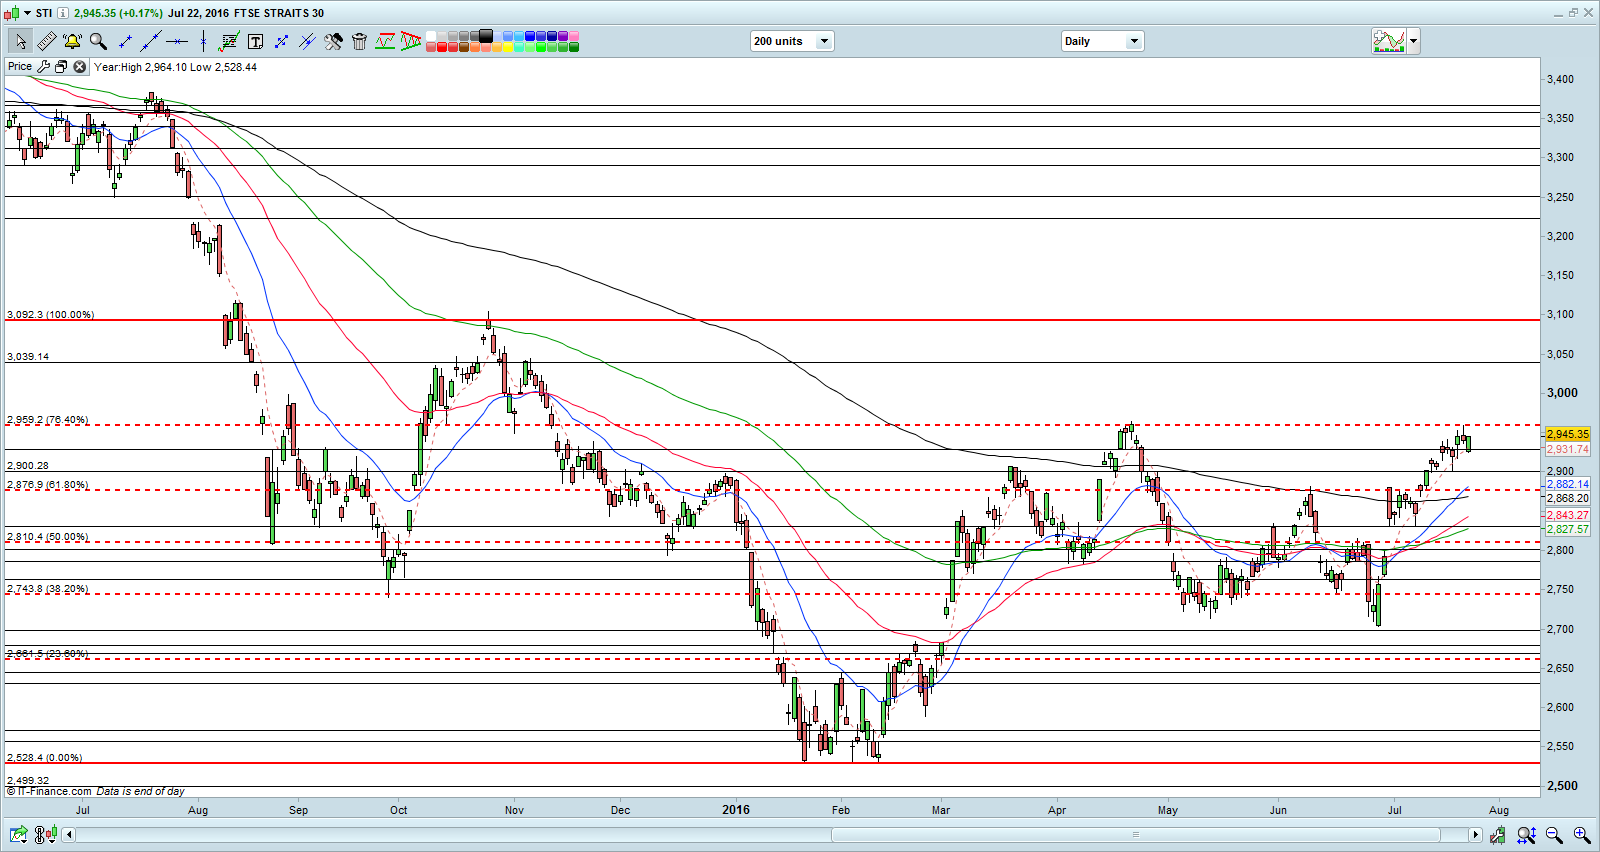
Source: CIMB chart as 22 Jul 2016
FTSE ST Small Cap Index (“FSTS”)
On 8 Jul 2016, I wrote that “Except for 21D EMA which has started to turn higher, the other EMAs are still trending lower. All in, FSTS looks bearish and weaker than STI. The bearish tinge is negated if FSTS can climb above 393 on a sustained basis.”
–> FSTS continues to lag STI. FSTS only rebounded 3 points, or 0.8% from 389 on 8 Jul 2016 to close 392 on 22 Jul 2016. STI jumped 98 points, or 3.4% from 2,847 on 8 Jul 2016 to close 2,945 on 22 Jul 2016.
Based on Chart 4 below, ADX has declined from 19.7 on 8 Jul 2016 to 15.5 on 22 Jul 2016. 21D EMA has started to move higher and may form a golden cross with 50D EMA in the next two weeks. 50D EMA is also trending higher. Chart is likely to turn positive if FSTS can climb above its declining 200D EMA (currently around 404) on a sustained basis.
Near term supports are at 390 / 388 / 386
Near term resistances are at 393 / 397 / 399 – 401
Chart 4: FSTS – likely to turn positive if it can breach 404 on a sustained basis

Source: CIMB chart as 22 Jul 2016
Conclusion
I have reduced my percentage invested from 76% on 8 Jul 2016 to 56% on 22 Jul 2016 by taking profit on some shares. In view of the upcoming 2Q results period, I am likely to do more trading, especially in the small to mid-cap space. For the next one month, I may increase my % allocation temporarily to around 150% if necessary. As I have always said, there are always opportunities in the market. (My clients have, will & are informed on new stocks which I have entered and any significant portfolio change.)
Readers who wish to be notified of my write-ups and / or informative emails, can consider signing up at http://ernest15percent.com. However, this reader’s mailing list has a one or two-day lag time as I will (naturally) send information (more information, more emails with more details) to my clients first. For readers who wish to enquire on being my client, they can consider to leave their contacts here http://ernest15percent.com/index.php/about-me/
Lastly, many new clients have asked me how I screen and decide which companies to take a closer look / write. To understand more about my basis of deciding which companies to write, you can download a copy of my eBook available on my website HERE.
P.S: Do note that as I am a full time remisier, I can change my equity allocation fast to capitalize on the markets’ movements.
Disclaimer
Please refer to the disclaimer HERE
I read with interest on your blog.
I decided to trade ISOTeam and made a small profit from it.
Thank you Ernest for this.
Regards
Nancy
Hi Nancy thanks for reading my write-up 🙂